Cloud Native Computing + Robotics = Magic
By Edgardo Peregrino View In Digital Edition
In my previous articles, I demonstrated how to control two robots using a GUI and also using a web application. Now, I’ll show you how you can go beyond just making your robots move and monitor them in real time. This can be accomplished using cloud native tools such as Docker, Kubernetes, Prometheus, and Grafana. In my previous article, I only showed you how to deploy your application with Docker, Kubernetes, and ArgoCD. This time, I’ll use that same project and take it to the next level with Prometheus and Grafana.
This can be useful in industrial applications such as monitoring robots that you might have in your factory — especially if you want to centralize your applications. In this article, I’ll show you how to use cloud native tools to monitor your robots and explain each layer at a time.
Getting Started
Before I explain each layer of the project, I did make some slight changes to the list of items I used to build my robots Linus and Torvalds. (See my previous articles for the full list of items.)
This time, I used a Pi 4 for Torvalds as I had been using it for another project. Also, I won’t be using the Pi Camera this time, but you can incorporate it if you want on your own.
Figure 1 shows both robots fully constructed.
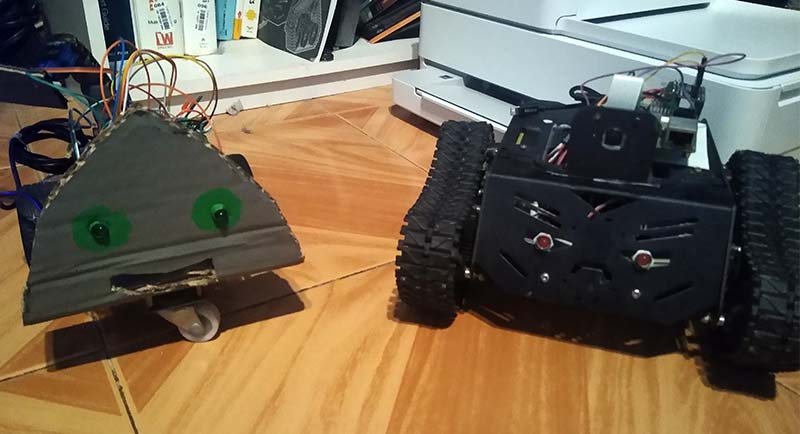
Figure 1: My two robots (Linus, left and Torvalds, right).
Both robots are running an older version of Raspberry Pi OS still known as Raspbian but you can use the new version if you choose. This time, however, you can use Raspberry Pi Imager to burn the image to each SD card instead of using something like Etcher.
Rundown of the Code
Before we can work up to the final product, we need to make sure the base code works first. The main code to focus on is app.py; this is the code that controls the motors of both Linus and Torvalds, controls the servo motors of Linus’ arm, and controls the speed of Linus’ motors.
So, this is similar to the code used in my previous article. This time, I added several new libraries which are Jaeger client and Prometheus Flask exporter. So, let’s break it down further.
Jaeger client is used here to detect spans and trace them utilizing its user interface called Jaeger UI. In this case, I defined a function called init_tracer which defines the Jaeger host. Also, notice I imported getenv from OS; that will be referenced when I talk about the Kubernetes layer.
I then defined a tracer with the name ‘stop-service’ but you can name it whatever you want. I created two spans called ‘torvalds-eye’ and ‘linus-eye.’ Here, any time their eyes blink, a span is reported and sent to the Jaeger UI which I will explain in that section.
Prometheus Flask exporter is used as a way to monitor your Python application in Prometheus. The data collected by Prometheus is then consumed by Grafana which I will explain later in those sections. For this to work, I defined my metrics by registering the paths and defining the endpoint_counter so that the endpoints appear.
Next, I add @endpoint_counter to each route so that Prometheus can collect data on them. When you get to 0.0.0.0:5000/metrics, you’ll see the list of metrics collected by Prometheus Flask exporter. This will be necessary for Prometheus to collect the data and send it to Grafana for consumption.
The static and template directories contain the HTML, CSS, and JavaScript files needed for the application to work properly. The app’s final design can be seen in Figure 2.
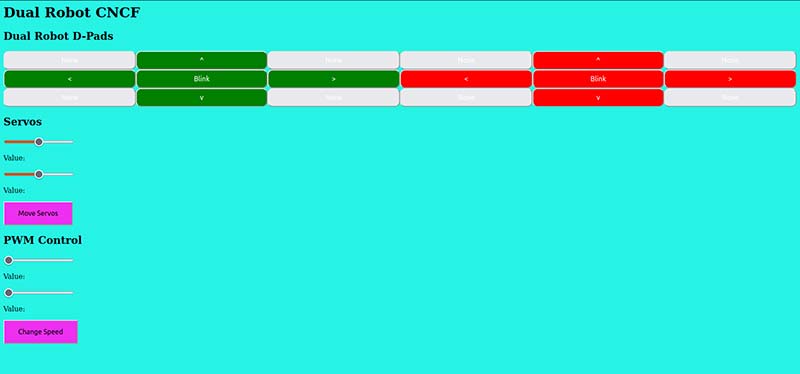
Figure 2: Main app design.
To run the code, I’ve provided a requirements.txt file; you can install these libraries by running either pip3 install requirements.txt or pip install requirements.txt. Once you have them installed, you can then run the application using either python3 app.py or python app.py.
From there, go to a web browser and then go to 0.0.0.0:5000. From there, you can run the application. Move the robots around and see if any problems arise. Make your own obstacle course and have them move around that.
If possible, you can take them outside and drive them around. The goal here is to make sure everything works just fine.
Docker Containerization
After the application has run successfully, the next layer (step) is to containerize the application with Docker. As I mentioned in a previous article, Docker is a containerization service that is used to contain applications that can be run on physical hardware or the cloud.
In the past, bare metal servers were used to run applications which proved to be very expensive. Later on, virtual machines were used to run separate applications which was very time-consuming because IT staff would have to do maintenance work on the virtual machines. Docker was created to allow applications to run on a single PC or in the cloud.
Make sure you have Docker installed on your machine first to get this going. However, you can use the Vagrant file I provided in the downloads as Docker will be installed there as well.
To run this application, we need a Dockerfile in order to build a docker image. The Dockerfile is provided to get things started. Here’s a comprehensive explanation of each line:
- FROM python:3.8 slim: This line defines what image type it will use. In this case, it will use Python 3.8.
- LABEL: This is optional and only used to list the maintainer.
- COPY: This copies all the files from the working directory to a directory called /app.
- WORKDIR: This sets the working directory to /app.
- RUN: This runs a command. In this case, it runs the command pip install -r requirements.txt.
- CMD: This runs the main command which is separated by quotes and commas.
First, we must build the image with docker build t dualrobot-cncf . — the period at the end indicates that we’re using the Dockerfile from the working directory. You can change it if you’re using another directory. Next, check that the image was created with the command docker images.
Next, run the image with docker run -d -p dualrobot-cncf 5000:5000. This runs the image detached in the background at port 5000. Check that the image was run correctly with the command docker ps. Then, go to 0.0.0.0:5000 and make sure you can run the application. There, you can also have your robots move around again to make sure everything is still running correctly.
Next, it’s time to register this image to your Dockerhub account. First, create an account there (it’s free) and then create a Docker repository called dualrobot-cncf. Next, go to the terminal and run the command docker tag dualrobot-cncf <your-username>/dualrobot-cncf:tag. Make sure you’re logged in with docker login and then run docker push <your-username>/dualrobot-cncf:tag. From there, the image has now been pushed to your repository with the latest tag you’ve given it.
Kubernetes
With the Docker image now created, the next step is to deploy it with Kubernetes. Kubernetes is a system for deployment automation and can be scaled depending on workload. You can install any flavor of Kubernetes you want. I used kind in my case. I also have k3s set up in the Vagrant file. Of course, if you don’t have the hardware to even run Kubernetes and want to run this in the cloud, you can use something like Amazon EKS, Google Kubernetes Engine, or even use Openshift. I have provided a dualrobot-cncf.yaml file under the kubernetes directory.
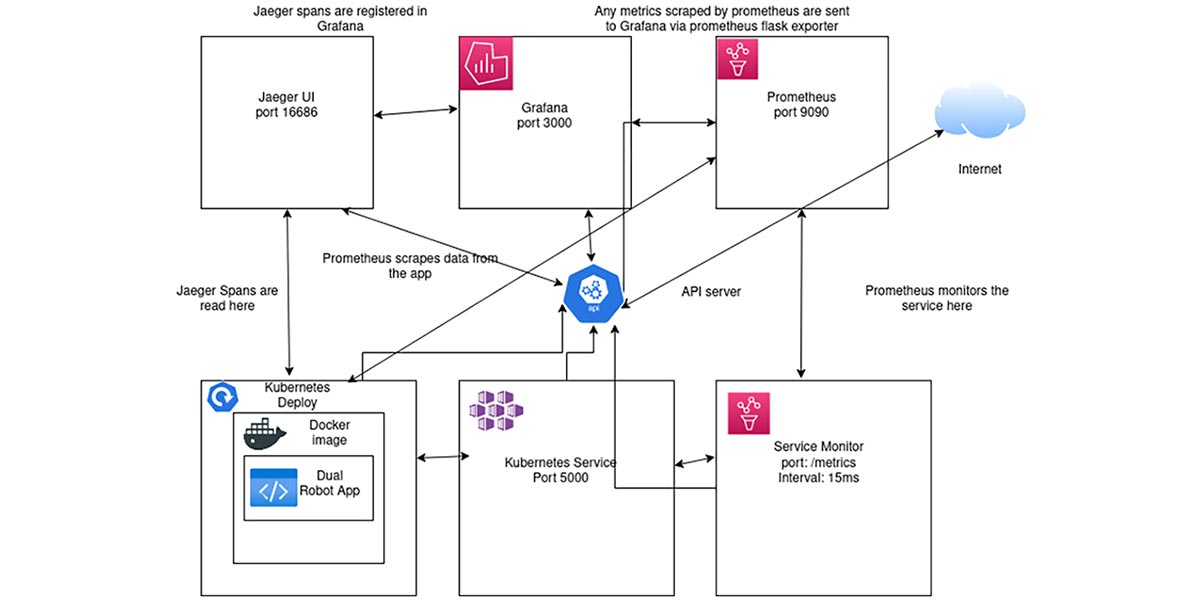
Figure 3 is a diagram that visualizes what the Kubernetes cluster looks like and how each service and component works.
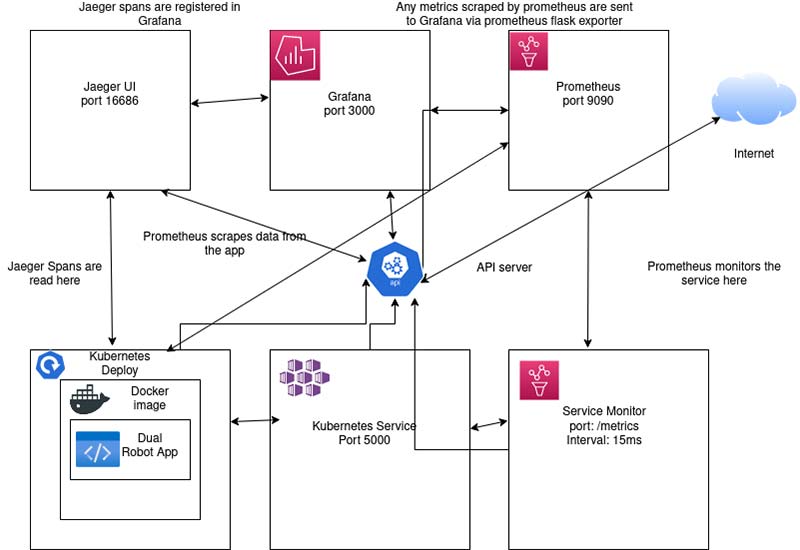
Figure 3: Kubernetes diagram for the app.
Let’s break down the file so you get a better understanding of what will be deployed:
- Deployment: This is required to deploy the application. Under here, a sidecar injection is added for Jaeger; this is required for Jaeger UI to detect any span. Also, notice the prometheus.io scrape, path, and port. These are required for Prometheus to detect any metrics. Under containers, there’s the env which has the name JAEGER_HOST that is referenced in the Python code. The value is also listed and (of course) you can change it depending on what Jaeger agent is listed in your cluster. Also, there is port 5000 which is named dualport; this is required as well for Prometheus.
- Service: This is used to expose the deployment and uses port 5000.
- ServiceMonitor: For Prometheus to work properly, this is required so that Prometheus can collect all data and send it to Grafana. In this case, it’s created in the monitoring namespace, uses metrics as the endpoint, and uses the interval 15 ms to scrape data.
To run this on your machine or on Vagrant, I’ve provided several scripts under the scripts directory in the downloads in order for this cluster to run. The easiest thing to do is copy and paste each command from each script. Use the monitoring-prometheus.sh and observability-jaeger.sh scripts to install Jaeger, Prometheus, and Grafana.
To run the main cluster, run the command kubectl apply -f dualrobot-cncf.yaml. To make sure everything is running correctly, run the command kubectl get deploy to make sure the deployment is listed as ready. Then, run kubectl get po; the pod should be listed as Running. If it’s listed as CrashLoopBackoff or Error, make sure to check that the Docker image was built correctly because that’s often the issue that leads to these errors.
Run the application kubectl port-forward svc/dualrobot-cncf 5000. If you’re running this using the Vagrant File, make sure to use 5000:5000 instead to expose it publicly. Then, either type localhost:5000 or <ip-address-of-vagrantbox>:5000 and it should appear. Move your robots around and make sure nothing is wrong.
Go to the metrics endpoint and make sure you can see the metrics being collected.
ArgoCD
This layer is completely optional but it’s a learning experience for those who want to know more about CI/CD. CI/CD or Continuous Integration/Continuous Delivery is a process used by DevOps engineers to automate and monitor software delivery. In this case, we’re using ArgoCD which is used to deliver any changes done in Continuous Integration.
If you want to deploy the application with ArgoCD you can start by Forking my GitHub repository and then making the necessary changes to suit your needs. I have provided the argocd-install.sh file under the scripts directory to automate the ArgoCD installation process.
To access the service, I’ve provided a nodeport file named argocd-service-nodeport.yaml file which uses the nodeport 30007 for HTTP and nodeport 30008 for HTTPS. Run kubectl apply -f argocd-service-nodeport.yaml and then access the service with kubectl port-forward svc/argocd-service-nodeport 8080:30007 or 8080:30008. If using Vagrant, all you need to do is to go to <vagrantbox-ip-address>:30007 or 30008.
If using your own machine or cloud service go to localhost:30007 or localhost:30008. Then, log in with admin and the password you created with the command provided in the argocd-install.sh script. Next, go and deploy the service with kubectl apply -f dualrobot-argocd.yaml and the cluster will be deployed on the ArgoCD UI. Figure 4 shows what the deployment will look like.
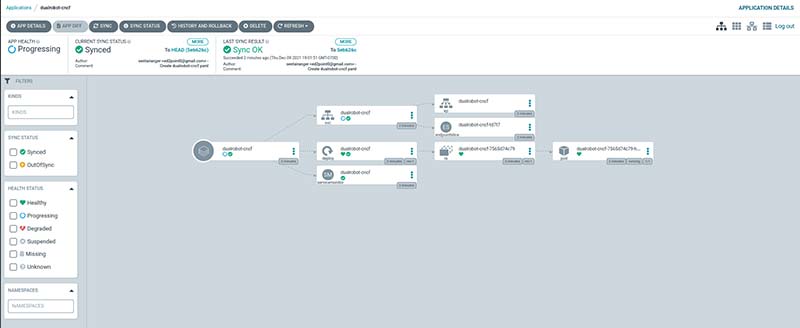
Figure 4: ArgoCD deployment sample.
Jaeger
As mentioned before, Jaeger is used to detect spans. In this case, Jaeger will detect any span whenever Linus or Torvalds blink their LED eyes. If you want to see an example of a span, take a look at Figure 5.
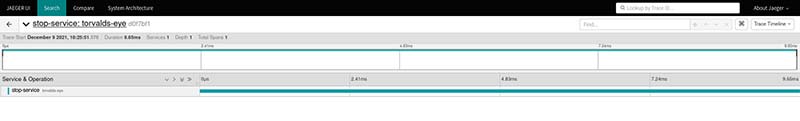
Figure 5: Sample span in Jaeger UI.
I’ve provided the helm-install.sh and observability-jaeger.sh in the downloads to install Helm and Jaeger. Helm is required to install the Jaeger service. To check the spans collected, you would have to port forward the default query agent; in my case, I would run kubectl port-forward svc/my-jaeger-tracing-default-query 16686 or 16686:16686 if running on the Vagrant Box.
You can go to localhost:16686 or replace localhost with the IP address of your virtual machine. You should see the Jaeger UI. Choose the service and click Find Traces. The traces you created should show up.
Prometheus
In this layer, Prometheus is used to scrape data from the metric’s endpoint as I mentioned before. So, when you move the robots around, move the servo arm, or even blink the LEDs, Prometheus will collect that data and send it to Grafana for consumption.
To make sure that the cluster can be seen under Prometheus, I’ve provided the monitoring-prometheus.sh script to install both Prometheus and Grafana.
Once they’re both installed, you should see both services show up using kubectl get svc. Next, notice there will be a service named prometheus-kube-prometheus-prometheus. You need to port forward that service with kubectl port-forward svc/prometheus-kube-prometheus-prometheus 9090 or 9090:9090 if using Vagrant Box.
Next, go to localhost:9090 or <vagrantbox-ip>:9090 and you should see Prometheus running. Go to Status, then click on Targets, and dualrobot-cncf should show up. If there are no errors, that shows that Prometheus is correctly scraping data.
Grafana
While it’s cool to see that your application is scraping data, it’s much cooler to see your data visualized. To do this, you can access the Grafana service with kubectl port-forward svc/prometheus-grafana 3000 or 3000:3000 again if using a virtual machine.
Go to localhost:3000 or <vagrantbox-ip-address>:3000 and you should see the Grafana dashboard login screen. Log in with admin and prom-operator as password. Please change that as that password is the default and can be a security risk.
I’ve provided a JSON file named Dual Robot Dashboard-1639100875721.json which sets up a dashboard without having to create one. Go to the plus sign on the left and import the file. It’ll ask you to browse your files, so do that and select the JSON file provided.
The dashboard should appear with all the metrics presented in a nice set of charts and gauges. Figure 6 shows what it looks like when you deploy it.
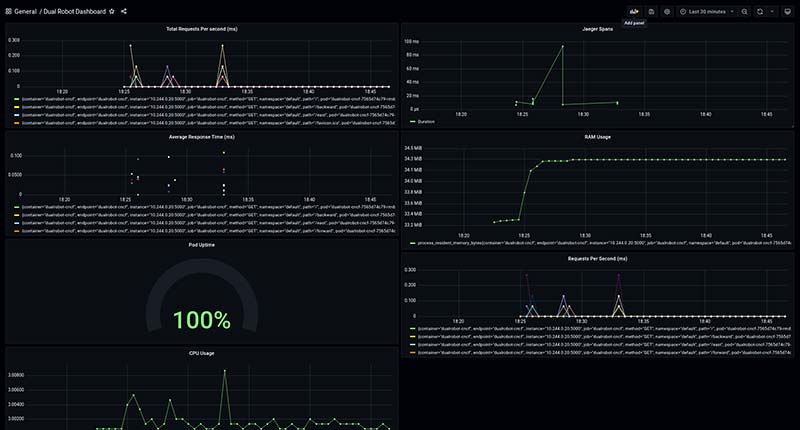
Figure 6: Grafana dashboard sample.
You can continue running your robots and the charts will update with the new data. The charts will always update so you can continue to monitor your robots to make sure you have no issues.
Running on Other Platforms
If you do want to run all this on a virtual machine, I’ve provided a Vagrant file which includes k3s, Docker, and Helm if you wish to simplify the process. Make sure you have enough RAM as it has 4 GB by default and has four CPU cores by default. You can make changes as needed to suit your needs.
Conclusion
Controlling robots is fun, but it’s always good to make sure your robots are running without any issues — especially if you’re in an industrial environment.
Here, I’ve shown you how to use cloud native tools to monitor your robots. You can do so much more with these tools. SV
Resources
My Dual Robot Monitoring Rep
https://github.com/sentairanger/Dual-Robot-Monitoring
K3s Lightweight Kubernetes Main Page
https://k3s.io/
Devastator Tank Mobile Platform that I Used for Torvalds
https://www.dfrobot.com/product-1219.html
CamJam EduKit 3 Link
https://camjam.me/?page_id=1035
Raspberry Pi Camera Mount
https://www.thingiverse.com/thing:3155461
gpiozero
https://gpiozero.readthedocs.io/en/stable/
Getting Started with ArgoCD
https://argoproj.github.io/argo-cd/getting_started/
Flask Tutorial
https://projects.raspberrypi.org/en/projects/python-web-server-with-flask
Jaeger Home Page
https://www.jaegertracing.io/
Prometheus Home Page
https://prometheus.io/
Grafana Home Page
https://grafana.com/
I want to dedicate this to Udacity, my classmates at the SUSE Scholarship Challenge, to SUSE themselves for being supportive, and to my dad who was always there for me. I also dedicate this to every person who owns a Raspberry Pi and wants some inspiration.
Downloads
202201-Peregrino.zip
What’s In The Zip?
All Code/Script/Etc. Files Listed in Article
Article Comments