The Multi-Rotor Hobbyist — FlyFi: Weather Data Telemetry
By John Leeman
Meteorologists have used weather balloons to measure and characterize the state of the atmosphere since about 1896, but technology has come a long way in the last 120 years. Temperature and dew point readings can tell us about the stability of the atmosphere and help us understand the severe weather risk on a given day. When working on my meteorology degree some years back, I loved looking at the radiosonde data from balloon launches. Multi-rotors can let us collect our own atmospheric data, and learn about the lower atmosphere and Wi-Fi in one project!
Weather balloons reach many thousands of feet before bursting, with their instrument packages collecting data on the pressure, temperature, dew point, and wind at their location (Figure 1). Every day, balloons are launched at 92 sites around the US just before 00Z and 12Z (UTC times). The history of weather balloons is so fascinating that I even produced a whole podcast episode on the topic (www.dontpanicgeocast.com/?p=318).
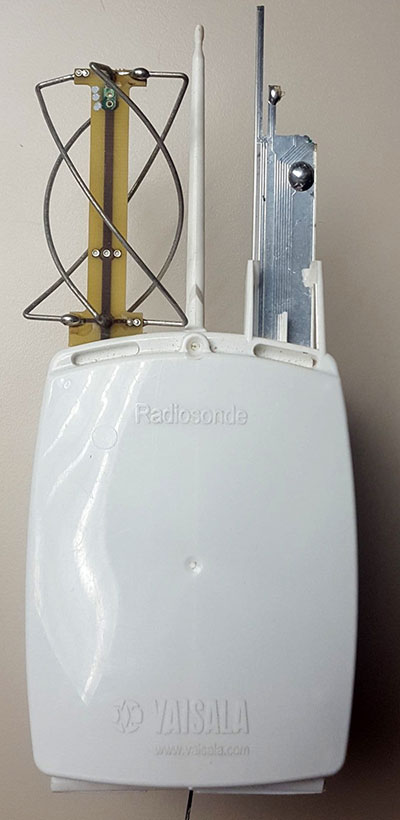
FIGURE 1 – A Vaisala radiosonde like those deployed every day to collect data on our atmosphere. This unit records the temperature, pressure, dew point, and GPS position.
The data they send back is vital to atmospheric models that help us predict the weather. Some near space balloon hobbyists have conducted similar measurements. (Be sure and check out the Nuts & Volts column on this exact topic called Near Space.) The balloons are generally valued for their high altitude data, but many interesting phenomena happen close to the ground in what is called the atmospheric boundary layer (ABL).
The lowest parts of the atmosphere are within the reach of our quads. Under certain conditions, many interesting meteorological phenomena happen close to the ground. I wanted to measure these for myself. So, in this article, we’ll build a versatile measurement platform and fly a few data collection missions.
Sensors
There are a plethora of atmospheric sensors out there. I’ve had great success using the SHT15 (or the HTU21D clone) to measure temperature and pressure, as well as the MPL115A1 for pressure measurements. In fact, the very first iteration of this project consisted of a breakout I made for those sensors, attaching them to the Bluetooth enabled LightBlue Bean from Punch Through Design (Figure 2). You can read about my early adventures in quad atmospheric measurement on my blog at www.johnrleeman.com/2015/07/30/drone-sounding-prototype.
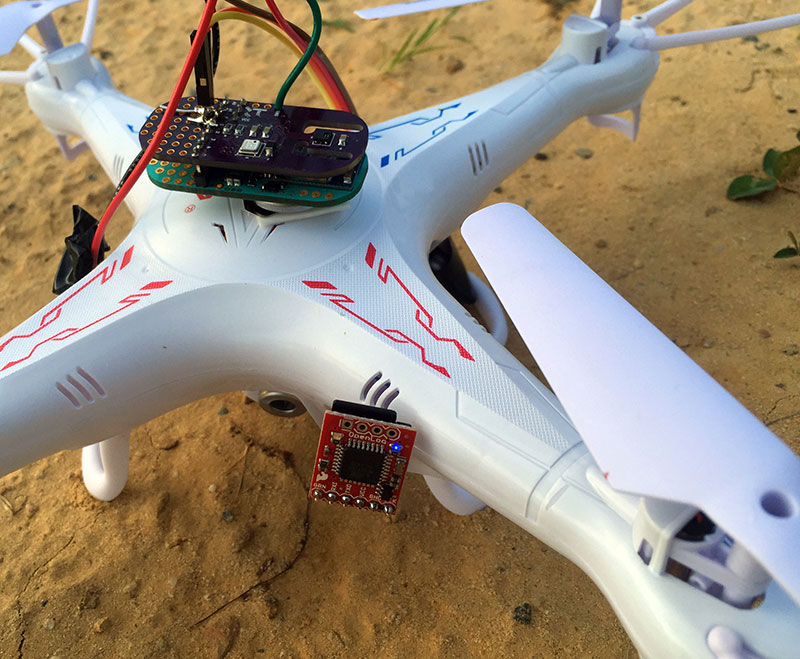
FIGURE 2 – My early attempts at collecting atmospheric data used a LightBlue Bean, a custom designed sensor backpack (the purple board), and an OpenLog to store the data. This setup worked for many test flights.
Bosch recently came out with the BME280: a single chip that measures temperature, pressure, and relative humidity with impressive resolution and accuracy unheard of a few years ago in a sub $15 chip. The problem is, though, it comes in a tiny surface-mount package. Luckily, there are a few folks out there with breakout boards available. I designed my own breakout before companies like SparkFun and Adafruit had one on the market. If you want to order your own printed circuit boards (PCBs) and reflow the boards yourself, the design files are open source and publicly available at https://github.com/jrleeman/BME280Breakout.
The BME280 can communicate with a microcontroller through the inter-integrated circuit (I2C) or serial peripheral interface (SPI) busses. I’ve worked with both of these busses a lot, but always tend to stick to I2C when given a choice. If you want to take a really deep dive into how these different interfaces work, check out the I2C/SPI learning kit available from Reingold Heavy (https://rheingoldheavy.com/product/i2c-and-spi-education-breakout-bundle/). There are Arduino drivers for the BME280 available from SparkFun and others (https://github.com/sparkfun/SparkFun_BME280_Arduino_Library).
Platform
There are several ways we can get data back from our sensor. The most obvious is to hook it up to the flight controller and add it to data packets that are already being transmitted back to the ground. This means that the data is collected at the same time as things like aircraft tilt, altitude measurements, etc., and can be directly plotted with those data. The disadvantage is that the setup is different for every flight controller out there, and picking one specific controller might limit how many of you can follow along.
It also means if one of my quads is down for repair, I may not have a way to take measurements. While this is not the end of the world, I thought that making an external telemetry system would be the best approach. This disconnects the sensor network from anything having to do with control and flight — a good safety precaution — and it means that I can transfer the sensors between vehicles with no problem.
Building a telemetry platform requires several subsystems to be connected in a reliable way. First, we need a microcontroller to handle all sensor and radio communication. We’ll also need a sensor system, communications system, and power system. While building all of these things from scratch is a lot of fun, not everyone has reflow ovens at home and wants to deal with pasting and building circuit boards. Looking at what is available, the ESP8266 jumped out. There have been many articles (including in Nuts & Volts) using this low cost microcontroller/Wi-Fi processor. It can be programmed with the Arduino IDE (integrated development environment) and has Wi-Fi on board — solving our communications problem as well.
That still leaves power as an unsolved problem. Dealing with the care and feeding of lithium-ion batteries can be a tricky business. Improper charging can lead to more than magic smoke, potentially a full-on battery fire. SparkFun has a board they call the “Thing” which has the ESP8266 with many useful pins broken out to 0.1” headers, as well as an antenna connection and battery regulator/charger. So really, we just need to connect a sensor and battery to the Thing and let it take care of the rest.
Hookup
The hookup for our weather station in the air is actually quite simple. You could solder these connections directly, but I decided that I wanted to use temporary connections so I can continue to change out sensors. I soldered in four sets of 10-pin Arduino style headers to the Thing. I also soldered some standard 0.1” headers onto my BME280 breakout. I then used some male-female jumpers to connect the sensor to 3.3 VDC, ground, SCL, and SDA. If you decide to use a different processor or platform, keep in mind that the BME280 is a 3.3 VDC sensor and connecting it to a 5 VDC logic device like an Arduino Uno will damage the sensor. If you are using a 5 VDC logic platform, use a level shifter!
The Thing has a JST connector for the battery, so just plug the battery in and plug the Thing into a USB charger to top off the battery (they are commonly shipped about half charged for optimal shelf-life). The connector is a micro-USB, so be careful to not apply too much force or it could snap off the PCB. Believe it or not, that’s all to the hookup there is!
Programming
Programming the Thing takes a bit of setting up. You’ll need an FTDI programming breakout and the Arduino IDE. Make sure your FTDI programming breakout is a 3.3 VDC model or that you have selected the 3.3 VDC setting on a multi-voltage model.
Setting up the Arduino IDE to program the Thing is much easier that it used to be. The board manager is now integrated into the IDE. First, go to File > Preferences (Figure 3) and add the URL “http://arduino.esp8266.com/stable/package_esp8266com_index.json” into the “Additional Boards Manager URLs” box. Next, go into the Tool > Boards > Boards Manager tool and find the entry for the ESP8266 and install it (one click install). After the install is complete, you’ll find the “SparkFun ESP8266 Thing” in the Tools > Boards listing. Select it and then make sure the correct port is selected for the FTDI breakout in the Tools > Port menu.
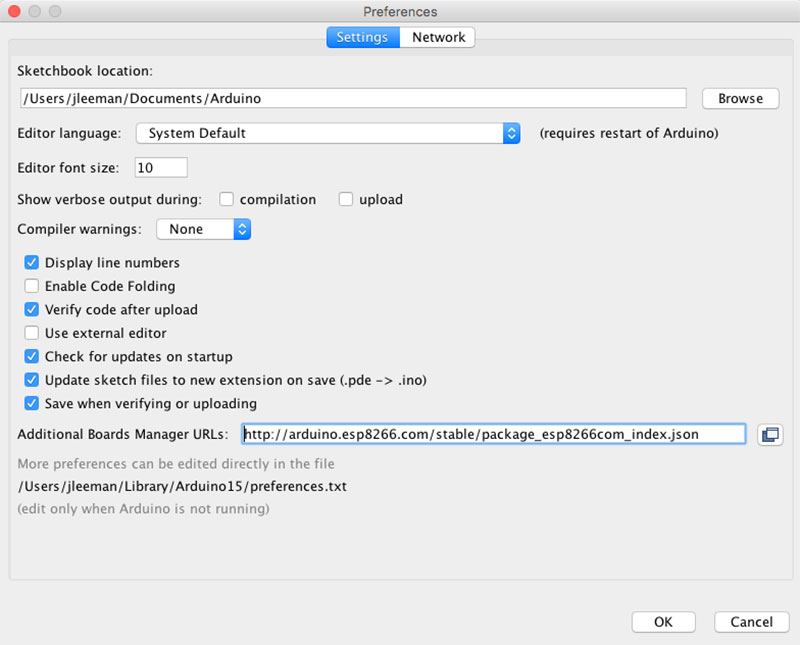
FIGURE 3 – Add the ESP8266 to the board manager URL box in the Arduino IDE preferences. This makes installing the board a one-click process. Much easier than it used to be!
Try programming the blink example from SparkFun (Figure 4). They recommend powering the Thing from a USB port during programming, but I had success on battery power as well. After uploading the sketch, you should see the onboard LED connected to pin 5 blinking. We’re now ready to upload the code for the FlyFi system.
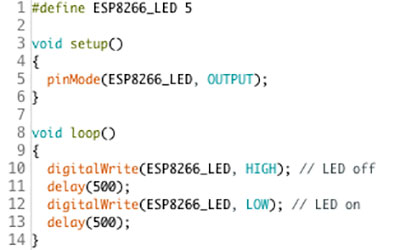
FIGURE 4 – A simple blink sketch for the SparkFun Thing. If you can successfully upload this, you’re all set to program the FlyFi sketch.
Download the code for the FlyFi by getting the zip file at the article link or downloading/cloning my GitHub repository for the most current version (https://github.com/jrleeman/FlyFi). Open it in the Arduino IDE and program the Thing just like you did with the blink example.
Firmware
Our firmware really just has to handle a few simple tasks. Since I often don’t have Internet out where I’m operating my quads, I need to make a system that operates without a true Internet connection. We could drag a router out to the field and connect the Thing and our computer to it, but that’s an unnecessary complication unless we want to connect with multiple nodes easily. In this case, we just care about the single node, so we can set up the Thing to act as an access point, creating its own ad-hoc network.
The firmware for our application really doesn’t go too much beyond the basics shown in the examples. First, the function setupWiFi sets the ESP8266 into access point mode and sets up the SSID and password for the network. Even though this is a non-critical system, I still recommend using in a password. There are constants at the top of the sketch that set the network name and password. If you use it as-is, the network will be called “FlyFi” and the password is “allyourbasearebelongtous” (yes, from the famous Zero Wing cut scene). Feel free to change this, but make sure the network password is over eight characters or there may be problems.
If you have a serial connection plugged in, the Thing will report its IP address and status to the serial terminal window. We set up the BME280 by reading its calibration numbers, and setting up the oversampling and filters to give us the best possible resolution from the sensor. Since we will ideally have pretty slow ascent/decent rates, the sampling rate is not nearly as critical as the resolution.
The main loop checks to see if any clients are connected to the network. If not, it just loops back around. However, if something is connected, it listens for traffic until the carriage return is found. Then, if the command portion of the call is valid, it takes the appropriate action.
In this case, you can use the commands “/led/0” and “/led/1” (after the IP address) to turn on or off the onboard LED as a simple test that the system is working. The command “/read” will return an HTML page showing the readings from our BME280. You can connect with your phone and easily check this (Figure 5).
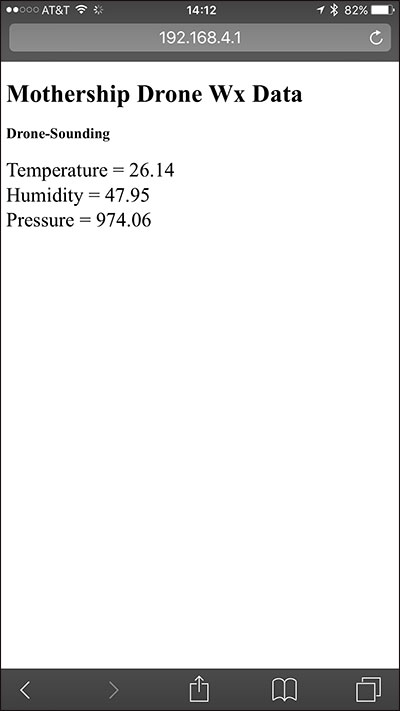
FIGURE 5 – By pointing your phone or computer web browser at the Thing (after you connect to the FlyFi network), you can view the sensor data and control the onboard LED. This is a handy way to check things during testing or with the unit as a weather station on your porch!
There are many possibilities to use this type of simple control strategy to trigger servos, motors, lights, or other accessories we might want to add to our multi-rotor. Once the request is filled, the client connection is closed.
Ground Station Software
My first instinct on the ground station software was to write a fancy GUI with live plots. I quickly dismissed this because I know I would be tempted to look at it. Remember, your only job is to fly safely and responsibly. You can have an observer monitor telemetry. For now, I decided to have a simple text in the terminal application that would read the values, write them to a file, and display them as text.
I wrote a simple plotting and analysis program that with one command would instantly plot the data from a flight, so there was still that rapid data visualization and analysis opportunity. I might revisit making a GUI at some point using LabVIEW, but for now this is plenty.
The ground station code is included in the zip and the GitHub repository. To use it, navigate to the “Ground_Station” directory and run the command python data_logger_simple.py my_data.txt to begin data collection. Make sure you are connected to the FlyFi network or this won’t work! If your computer does not have an installation of Python on it, the Anaconda distribution is easy to install and will install many additional packages with ease (https://anaconda.org).
Once the program begins running, it will make a call for data every 0.1 seconds (adjustable by the samples_per_second variable in the script). The function get_data_HTTP makes the call and parses the returned HTML page for the data values. This could be done more elegantly with more complex regular expressions, but this is much more readable and fast enough.
The program then writes the pressure, temperature, and relative humidity out to a text file, as well as the terminal standard out (Figure 6). In this case, the text file is called my_data.txt, but you can change that when you start the program to whatever you’d like to call the file. Be warned! This is a destructive start – if you name the file the same thing you did last time, it assumes you want to replace it. Generally, this is the case. However, think before hitting enter. To stop data collection, press control+c and the program will stop.
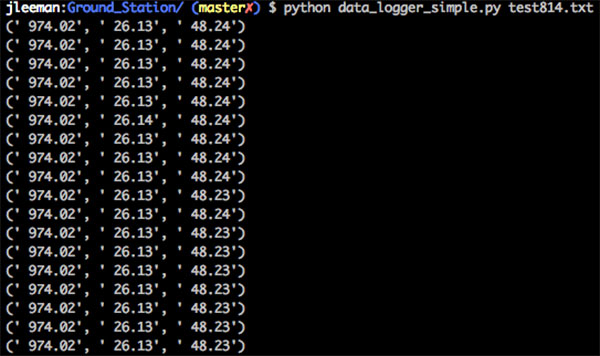
FIGURE 6 – Using the Python data logger is as simple as opening a terminal and starting the program with a file name as an argument. You will see the raw data begin to scroll across your terminal.
The companion program plot_data.py processes the data and makes a nice plot. To use it, call python plot_data.py my_data.txt and the file my_data.txt will be analyzed. The links that explain the math used in the program are in the comments of each function. I’ll spare those of you who get a little queasy at the sight of large equations here.
This program calculates the altitude of your drone, assuming that the first readings are at ground level. It also calculates the dew point of the atmosphere by using the temperature and relative humidity. It then uses this data to make several plots for us (Figure 7).
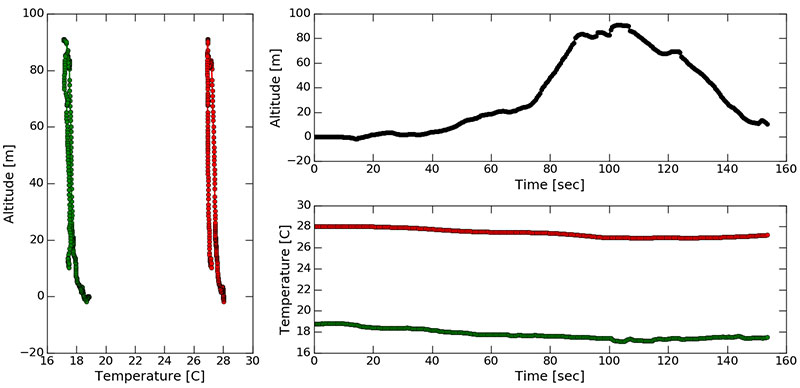
FIGURE 7 – The output of the plotting script shows you a time series of the flight altitude, temperature, and dew point, as well as the temperature and dew point plotted with altitude. This is a quick and easy way to examine your data. The pop-up window with the plot is also zoomable.
First, there is a plot with altitude on the Y axis since that’s how we think of altitude. We don’t normally plot the independent variable on the Y axis, but in this case, it makes much more intuitive sense. The altitude plot has the temperature and dew point both plotted on it in red and green, respectively.
There’s also a time series plot showing the altitude, temperature, and dew point during the flight. This relatively simple initial analysis can show you interesting things about the atmosphere including the atmospheric lapse rate, or how fast temperature changes with height. You can also see if the temperature at a given altitude changes as you move over different surfaces; say, grass to concrete.
The Crash
I wanted to test the setup very quickly, so I put the electronics and battery inside a small cardboard box and used a simple cutout to let the sensor dangle outside the box. I also cut a hole in the side for a Wi-Fi antenna feed through that I thought would be necessary. While not an incredibly robust enclosure, I thought the box should do the job for a few initial flights. I punched two holes in the top and used a zip tie to secure the box and instrument package below one of the landing legs on the Parallax ELEV-8 quad.
After a couple of initial tests, I thought it was time to get some data from an interesting environment. I went over to see one of my friends who is also into environmental sensing, and we waited until a thunderstorm was nearby. After the gust front had passed, we decided to fly and collect some data.
It was still windy, but the ELEV-8 did a good job of fighting the wind, and we completed several successful flights (Figure 8). I wanted to see what the hysteresis of the sensor looked like, so I wanted to go up very quickly and then slowly come down and compare it with going up very slowly and coming down quickly. Unfortunately, about the time that I hit the throttle to climb skyward, there was a large gust of wind that flipped the quad over.
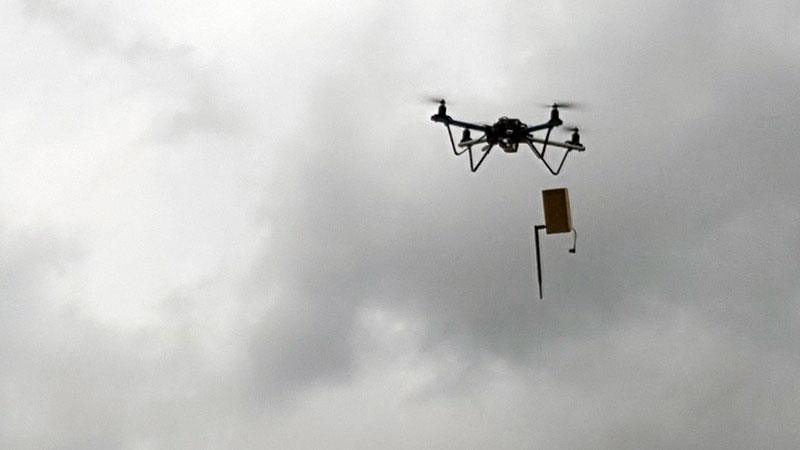
FIGURE 8 – The initial prototype of the telemetry package was suspended beneath the ELEV-8 quad for several test flights in the outflow of a thunderstorm. Notice the sensor is hanging free in the air on the right of the package.
I was probably about 10 m off the ground when this happened and was almost able to recover. Unfortunately, since I had just zip tied the sensor pack below one of the legs on the quad, it fell and fouled one of the propellers. This resulted in a rapid unscheduled disassembly (RUD) as Elon Musk would say. The quad hit the ground what looked like pretty hard and I was a little scared to go see the damage. Approaching the crash site, we saw pieces of wire and parts of the sensor pack lying in the field. It had been chopped completely by the propeller. Amazingly enough, when we found the quad, only one motor mount had been broken and one landing leg was twisted slightly (Figure 9). With a few dollars in parts and a few minutes, it was ready to fly again. We decided not to fly again that day though, as the wind was continuing to increase in strength.
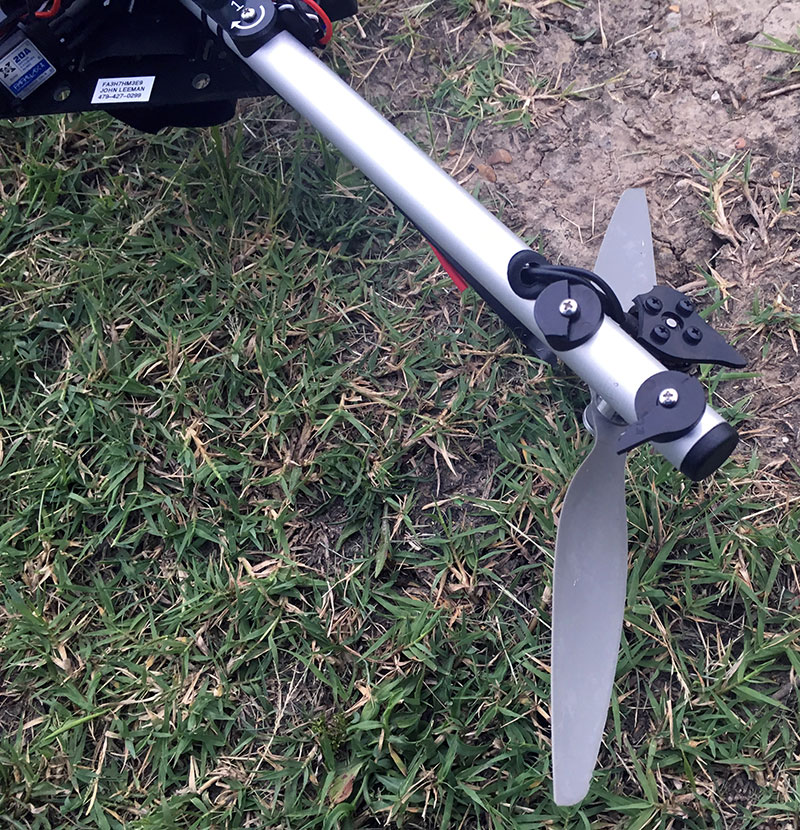
FIGURE 9 – After the crash, amazingly the only damage was a broken motor mount and slightly bent plastic landing leg. With a few minutes of work, this was all repaired. Remember to always stock a few spare parts!
The meteorology package suffered significantly during this crash. Not only were the wires to the sensor severed by the propeller (Figure 10), but the box itself was sliced open.
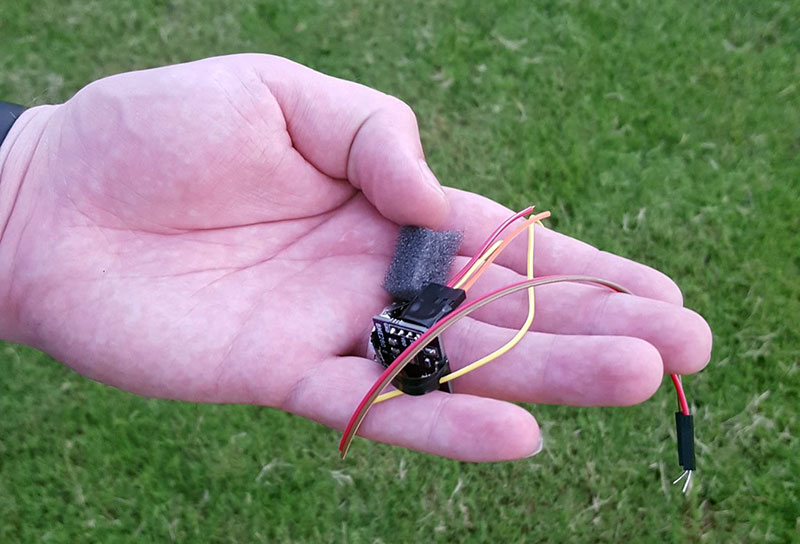
FIGURE 10 – The propellers severed the wires running to the sensor. Finding this small dark colored breakout board in a field shortly before it began raining was quite a challenge.
There was a dent from one of the propellers in the battery, as well as the battery wires being cut off (Figure 11). Knowing the dangers of damaged lithium-ion batteries, I did not attempt to charge or reuse this battery, but safely disposed of it at a recycling center.
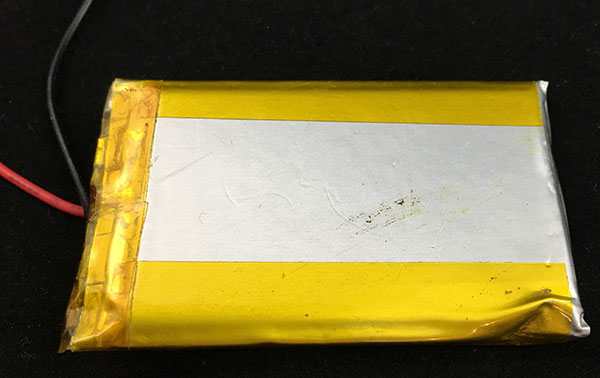
FIGURE 11 – The battery powering the Thing was damaged pretty badly. The propeller cut the wires and impacted the side of the battery. Batteries with this kind of damage should not be reused, but safely recycled.
The Thing itself had a bent battery connector that was completely filled with dirt and was covered in other debris (Figure 12). Luckily, there appeared to be no damage to the printed circuit board, and after minor repairs everything worked just fine.
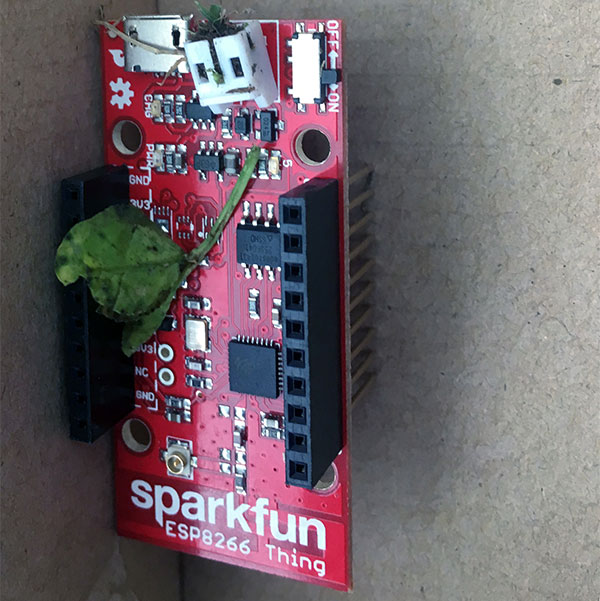
FIGURE 12 – When I found the Thing, there was dirt jammed into the battery connector and various debris stuck in and on it. Luckily, there was no damage to the PCB and no components were ripped off.
Improvements
After the first test, it was obvious that a few improvements could be made. First, the range of the Thing by itself was not great. It didn’t reach from one end of my house to the other very well at all. I purchased a connector and external Wi-Fi antenna on Amazon and they extended the range greatly, or so I thought. The tests showed that I was able to get much greater range than with the antenna disconnected, but it must have been capacitively coupled on the PCB, because I had not yet rotated a jumper to use the external antenna instead of the PCB antenna as directed by the SparkFun instructions (Figure 13). After rotating the jumper, the gain increased even more. This extended range was great because I did not want to lose data as the drone approached its operational ceiling.
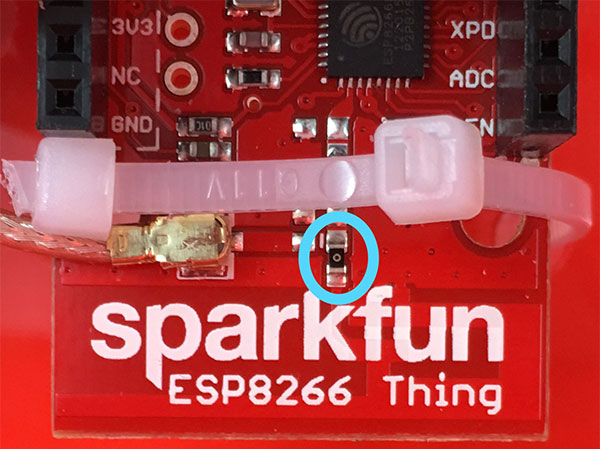
FIGURE 13 – Rotate the jumper circled in blue 90 degrees to connect the external antenna directly to the ESP8266. You can see the tracks easily, but they are close enough there is still some coupling that happens.
Next, I needed to make the Thing more robust; that meant removing PCB mount connectors. I desoldered the bent JST battery connector and looked for a replacement. To help this not happen again and maybe not break the PCB during another crash, I bought a package of two-pin leaded male-female connector pairs. I soldered one onto the board and the other onto the new battery. These connectors are not locking, just a friction fit (Figure 14). In the event of a crash, my hope is that they will separate easily instead of breaking connectors, pulling out wires, or doing other damage to the hardware.
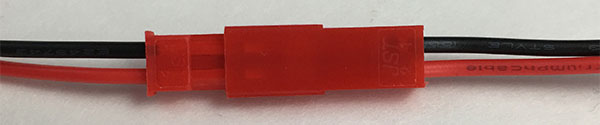
FIGURE 14 – These JST connectors are inexpensive and just a friction fit, allowing them to break loose in a crash. I’m hopeful that this will save my hardware from damage in the event of another accident.
Real weather balloons have their instrument package many meters below them on a tether to ensure the instrument measures air that is not disturbed or warmed by the passage of the balloon. I had an old plastic box from RadioShack that held a kit of components. It had a pegboard hang tab on top of it that is perfect for securing it far below the quad with some string.
I laid all of my components inside the box and drilled holes to use zip ties to secure the Thing and the battery (Figure 15).
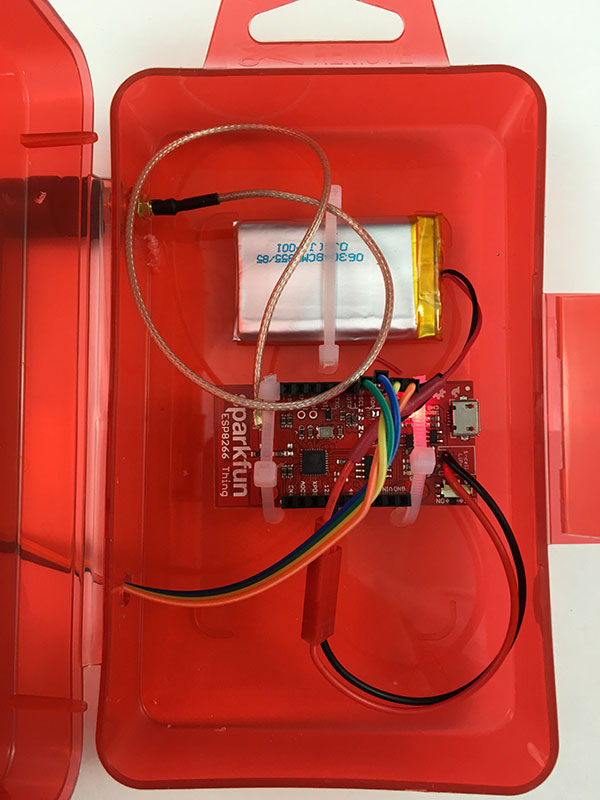
FIGURE 15 – Place the Thing, battery, and feed throughs into the case. Drill a few holes to secure everything down with zip ties. Again, the zip ties can provide some flexibility to the mounting system in the event of an impact.
I drilled a hole in the side for the antenna feed through, and drilled and filed out a hole in the opposite side to allow a micro-USB charging cable to pass through the case. One final hole let the wires for the atmospheric sensor exit the unit (Figure 16).

FIGURE 16 – Drill two holes in the side of the case for the sensor wires and the SMA connector feed through. I tried to keep these as small as possible, so if it were to begin raining, a minimal amount of water could get into the package.
A final improvement made the sensor provide more consistent readings. The very disturbed air near the propellers could cause erratic pressure readings on the BME280. I used a trick from the Parallax flight controller, and attached a small piece of very porous foam on top of the sensor to act as an air baffle (Figure 17).
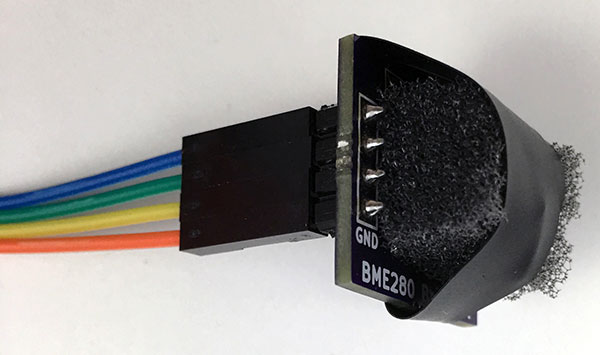
FIGURE 17 – Adding a piece of foam on top of the sensor should reduce noise from fast and turbulent airflow over it. The foam is very open though, allowing fresh air to vent through.
With these improvements, the data from the package looks very nice and the package is more durable than the original prototype (Figure 18). It could even be adapted to collect data from your porch when not in aerial use for your own personal weather station. There's also a lot of program space left, so adding additional sensors would not be a problem. The only thing missing from our data stream are wind estimates.
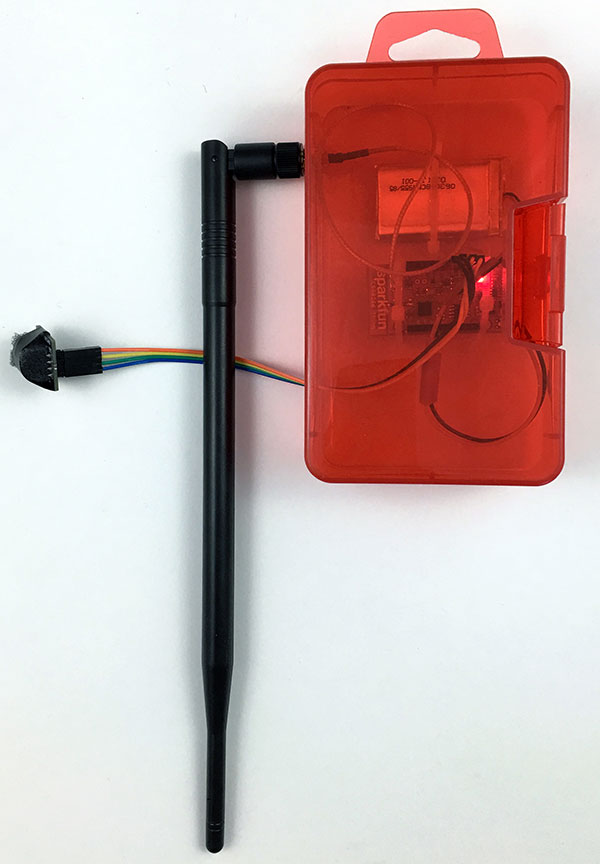
FIGURE 18 – The completed sensor package looks very professional and is water-resistant. It was a great way to repurpose an old plastic box. The hang tab on the top is just an added bonus as I can suspend the sensor with some string.
Weather balloons are tracked with GPS and their position used to estimate the wind at different altitudes. For our drone soundings, we could use a carefully placed anemometer or pitot tube, or try to calibrate the motor output power ratios to provide a wind speed estimate as the drone tries to hold its position. That's a bit more advanced project for another time though, as it involves modifying the telemetry stream and some pretty detailed calibration.
Results
The results from the initial tests look very good. Meteorologists use the dry and moist adiabatic lapse rates to describe how temperature is expected to change with altitude. As the sun warms the ground, the ground heats the air near it. This warmer air becomes more buoyant than the surrounding air and begins to rise, expanding as it does so. The expanding air cools as air is doing work against the atmosphere, and the low thermal conductivity of air does not allow it to easily exchange energy with its environment. This so-called dry adiabatic lapse rate is about 9.8°C per kilometer.
When moisture is involved, things are complicated somewhat because water has a latent heat of vaporization. As the air rises, it does cool, but when it becomes saturated, the water condenses and releases heat in the process. The release of heat decreases the atmospheric lapse rate to about 5°C per kilometer.
In the flights immediately after the thunderstorm front had passed, we would expect to find the near ground atmosphere having approximately the moist adiabatic lapse rate. Our data shows the lapse rate in the lower 300 feet of the atmosphere to be about 7.8 °C/km on the second flight and 3.9 °C/km on the third. Not too bad! These numbers are from the slowest ascending passes I flew. The faster passes had too steep of lapse rates from the hysteresis/response time of the sensor, I believe.
There are small dew point variations with altitude, as well. The profiles collected on the ascending and descending parts of the flight are slightly different, suggesting there’s some hysteresis or memory effects in the sensor. It would be nice to characterize these better and possibly try an enclosure that is vented to obtain more consistent readings. Putting the sensor in a radiation shield would be a good start. There’s a paper to draw inspiration from published in “Agricultural and Forest Meteorology” by Holden et al. (2013). The full text is available at www.fs.fed.us/rm/pubs_other/rmrs_2013_holden_z001.pdf
We can also plot the data on a meteorological diagram called a Skew-T Log-P (Figure 19). This peculiar diagram makes analyzing the stability and condition of the atmosphere much easier to those who know how to use it. In this diagram, pressure is on the Y axis on a logarithmic scale. Temperature is on the X axis, but skewed at about 30°.
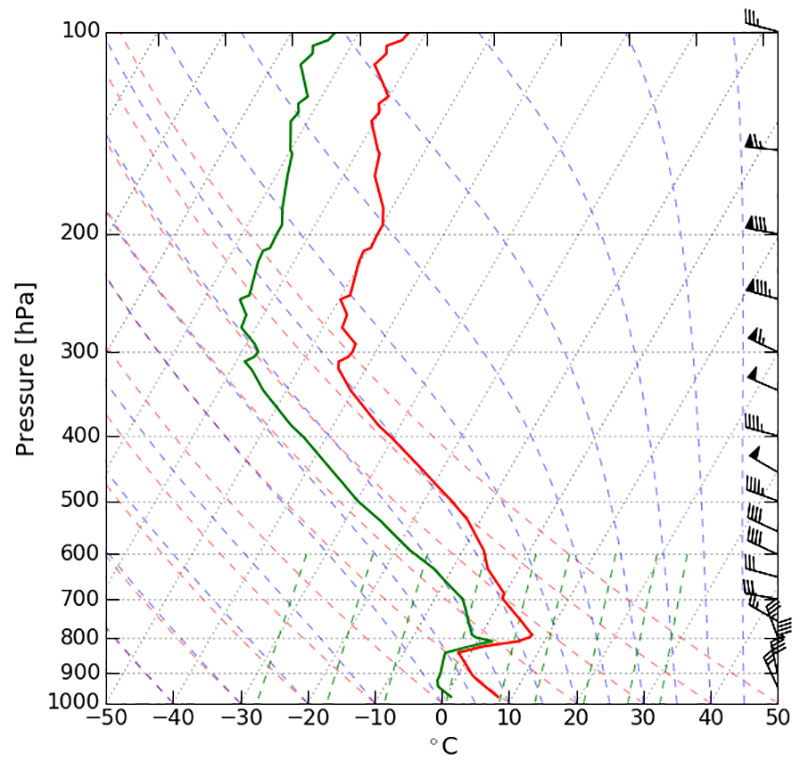
FIGURE 19 – An example Skew-T diagram with data from a real radiosonde launch plotted. Our data covers a very tiny span of the Y axis, but a modified Skew-T would be an interesting way to look at the data and judge the lapse rates instantly.
It is also common to see moist and dry adiabatic lapse rates, as well as mixing ratios plotted on the diagram. For the limited height range that we can access, these diagrams are not incredibly useful, but if you find a situation with very interesting lower atmospheric conditions, it could be an cool way to look at your data. There are number of programs available to plot Skew-T diagrams. Staying in the Python ecosystem, MetPy (https://github.com/metpy/MetPy) is the package to use.
Closing Thoughts
Now that you've got your own personal lower atmosphere data collection system, go out and collect data on days with interesting weather: foggy days, just before and after storms, winter weather events, and profiles over different types of surfaces. These would all be compelling experiments to perform.
Since our data collection and telemetry platform is completely separate from that of the aircraft, you can add as many sensors or change the package as much as you like. Utilize it on any drone, model aircraft, or other simple monitoring application. If you collect some interesting data, let us know! NV
Resources
BME280 Sensor Breakout (www.sparkfun.com/products/13676)
SparkFun ESP8266 Thing (www.sparkfun.com/products/13231)
Li-Poly Battery, 850 mAh (www.sparkfun.com/products/341)
M/F Jumper Wires (www.sparkfun.com/products/12794)
FTDI Basic Breakout 3.3V (www.sparkfun.com/products/9873)
10-Pin Header (www.sparkfun.com/products/11376)
JST Connectors (https://amzn.com/B00EZH92JE)
Antenna Feed Through, RP-SMA to U.FL (https://amzn.com/B009UMQ23I)
Wi-Fi Antenna (https://amzn.com/B004UBUE2O)
Enclosure and Zip Ties
Article Comments