Servo Magazine ( September 2017 )
Scanse Sweep 3D Scanner Review
By John Leeman View In Digital Edition
Lasers and robots — how any good project, story, or article begins. I recently got the chance to try out the Scanse Sweep and their 3D scanning kit. The Sweep puts the power of LIDAR in your hands. Applications range from obstacle avoidance to mapping of new areas. We’ll assemble this brand new kit and take some scans in a variety of environments to see how this affordable sensor stacks up.
LIDAR is a way to use light to measure distance. The term was originally a portmanteau of light and radar, but has since been “backronymed” to Light Imaging, Detection, and Ranging or LIght Detection And Ranging. Believe it or not, the technology originated shortly after the invention of lasers, and has been used to map the surface of the moon during Apollo, help robots avoid running into obstacles, and create models of objects and nature for scientists.
Like all technology, the price of instruments has come down with time. While still expensive, they became affordable for street mapping vehicles, self-driving cars, and eventually for land surveying. The Sweep is an effort at bringing the price point of a basic LIDAR to the consumer/hobbyist level.
The Sweep launched on Kickstarter where I initially backed it, thinking it would be a fun exercise to play with for mapping. As a caver, I’ve experimented with both laser and ultrasonic mapping of caves in the past with mixed results. I was especially excited when Scanse announced a 3D scanner kit for the Sweep, and they agreed to send me one of the first production units to try out.
This month, we’ll go through the kit assembly process, install the software, and take a few scans. I tested the scanner indoors as well as outdoors to really get a feel for how it performs in a variety of environments.
I also verified the accuracy of measurements by comparing the Sweep’s measurements to actual measurements of rooms in my home.
Unboxing
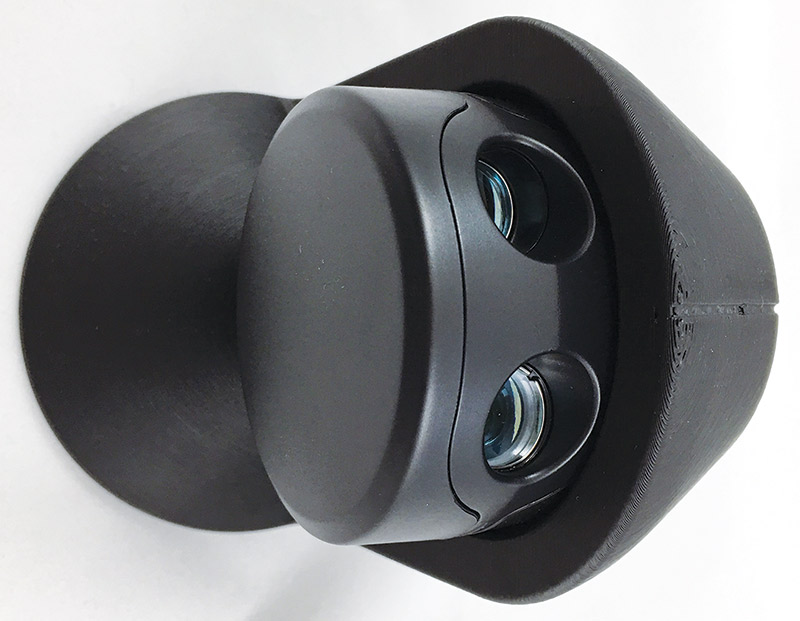
The kit arrived in a surprisingly large box, but the extra space was used to pack everything very well. The Sweep sensor itself is in a very nice professionally printed box with foam cutouts. It comes with a connector and USB interface. Standing alone, the Sweep sensor (Figure 1) will produce 2D scans of a space.
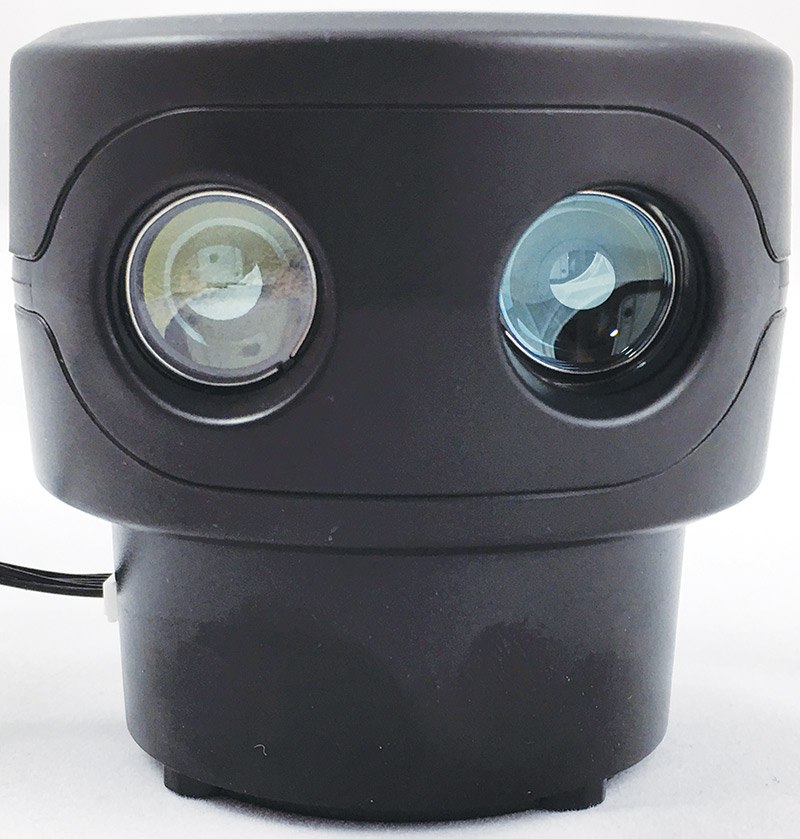
Figure 1. The Sweep sensor itself is a nice compact unit that scans a laser range finder through a full circle, returning range and bearing information.
Playing with it in my office, I was able to determine how full each shelf of books was on a bookcase a few meters away. What I was especially excited for was getting the scanner assembled and producing some 3D maps of spaces! The Scanner kit consists of some breakout PCBs (printed circuit boards) from Adafruit, USB cables, a stepper motor, micro switch, SD card, and some hardware (Figure 2).
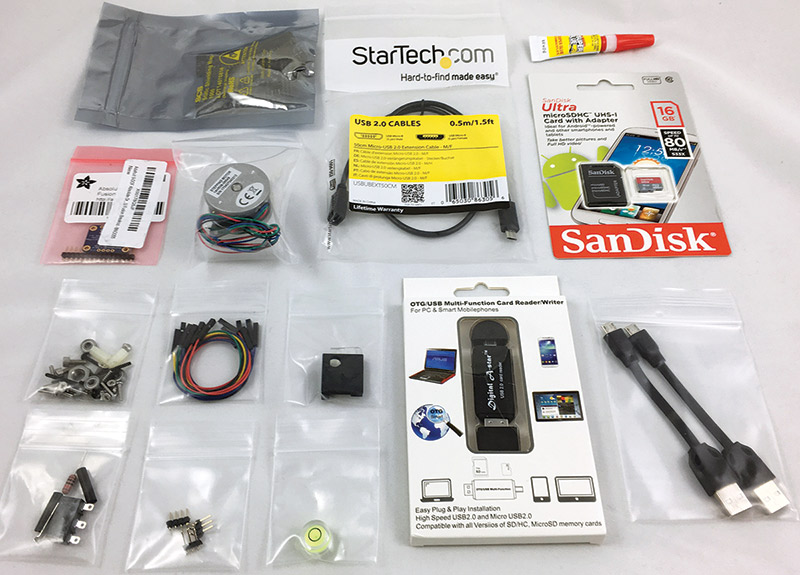
Figure 2. The components packages for the kit are nicely grouped and well packed. There are a lot of components in a complex electromechanical kit like the Sweep 3D scanner.
There is also a Raspberry Pi with a USB battery (Figure 3),
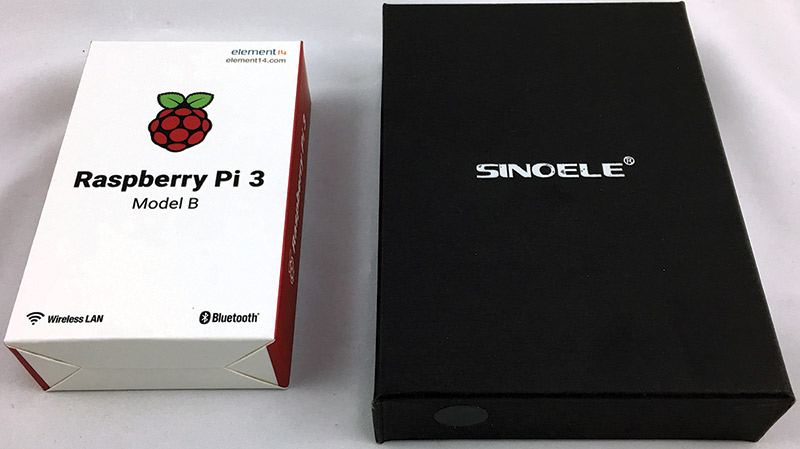
Figure 3. A standard Raspberry Pi and USB battery are provided to control and power the scanner.
and three 3D printed enclosure components (Figure 4).
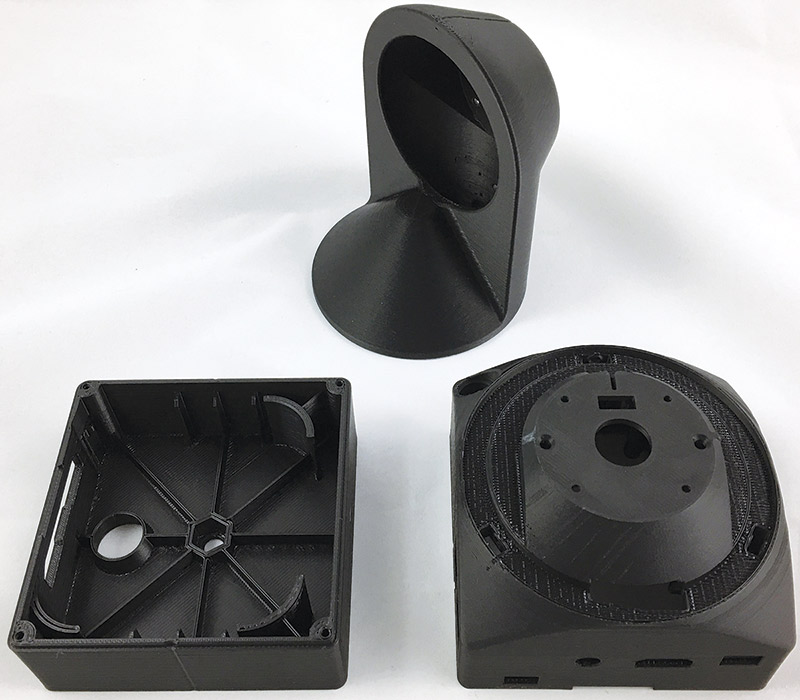
Figure 4. Three 3D printed components are included to make up the scanner enclosure. The prints were very high quality with no visible layer separation or print issues.
The design of the 3D printed enclosure is stunning, with a lot of thought and undoubtedly trial and error going into the design. The gusseting on the bosses for different mount points looks very similar to that used for injection molded designs (Figure 5).
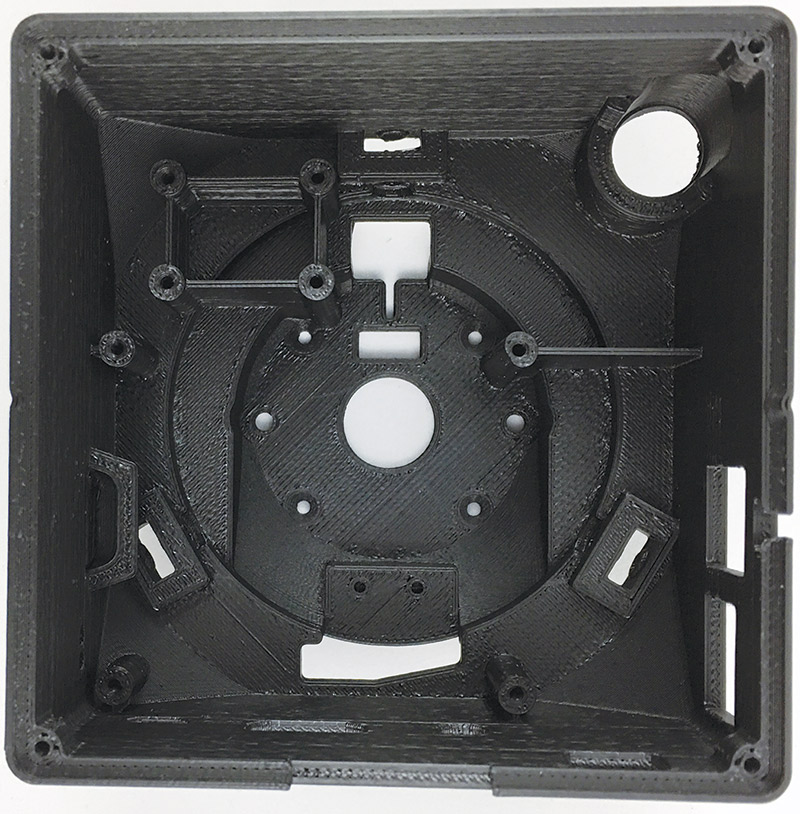
Figure 5. The mechanical design of the housing was stunning. Very nice attention to detail and proper gusseting/design of the bosses for component mounts.
This kit lies in an interesting space between full-fledged consumer product, hobby project, and rapid prototype. There are clearly a lot of engineering hours put into the design, but it still uses commercially available breakout boards, prototype style electronics construction, and 3D printed parts. It’s exactly where such a cutting-edge concept needs to be — especially when feeling out the market.
Assembly
The first thing to do once you receive the kit is to head over to the Scanner’s website at http://scanse.io/3d-scanning-kit and download the assembly guide. I’m sure that this is updated as suggestions and modifications occur, so always check back for the most recent document. I found a few minor differences in parts provided vs. those shown in the instructions, but certainly nothing that made them difficult to follow.
Since this kit has a decent number of components, I cleared off my workbench and carefully knolled everything. First, I checked over all the 3D prints, removing any stray printing cruft and making sure there were no issues. You can 3D print these parts yourself or buy the kit with the parts included. Overall, the print quality was very high on these parts with no observable layer separation issues or overly long bridges.
Next, I installed the three bearings that carry the axial load of the scanner and mount. This is again a nice touch, as many would likely have simply let the stepper motor carry this load which would ultimately reduce its life and maybe even result in more lost steps. The bearings are affixed with machine screws.
The screws are installed with a 2.5 mm hex wrench (not included). Access to install and tighten them was sparse, so I ended up using the short side of the key and lots of small motions (Figure 6). A few extra access holes would be nice, but I also understand not wanting any extra holes in the enclosure from an aesthetic standpoint.
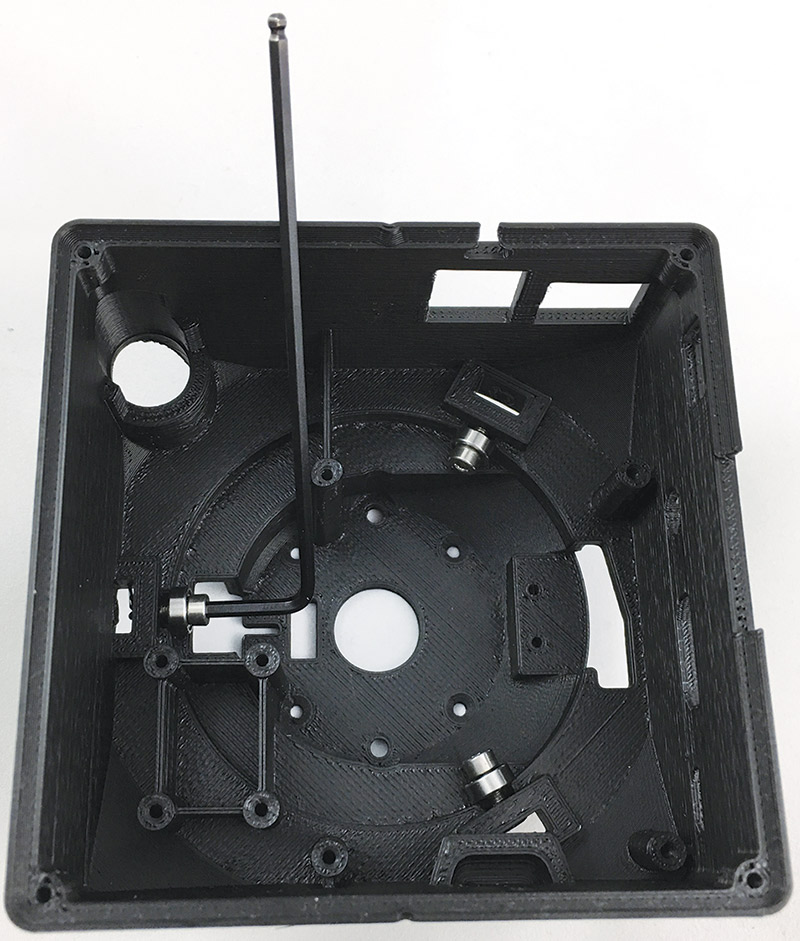
Figure 6. Getting the bearings secured was a bit of a challenge, but with some patience, all three were successfully installed. Using the short side of the hex key helped a lot.
With the bearings in place, it was time to install the micro switch that served as a homing/limit switch for the device. I soldered the 10K resistor on the switch and the associated jumper leads, then insulated the whole thing with heat shrink tubing (Figure 7).
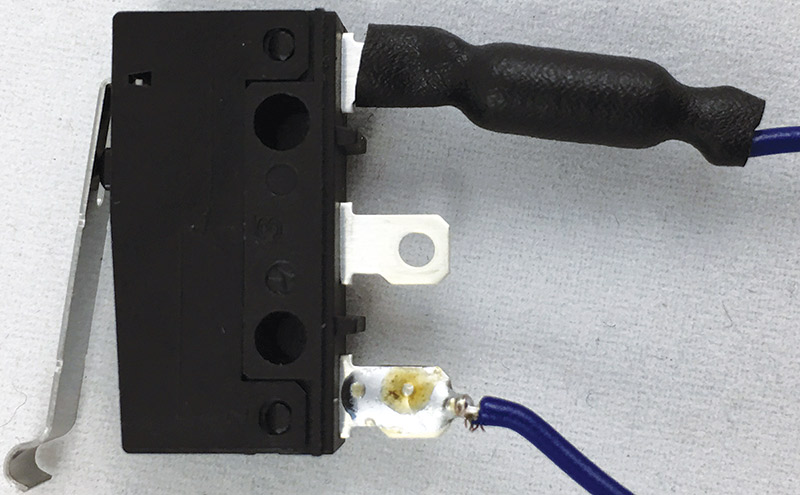
Figure 7. The contacts on the micro-switch either were not labeled or labeled in a difficult-to-read engraving on the plastic. Quick verification with the multimeter showed that this was the correct hookup.
The resistor in my kit was quite large — maybe 1W or so — which seems unnecessarily rated and larger than the one in the assembly guide. It still fit into the enclosure and the switch was secured with two screws (Figure 8).
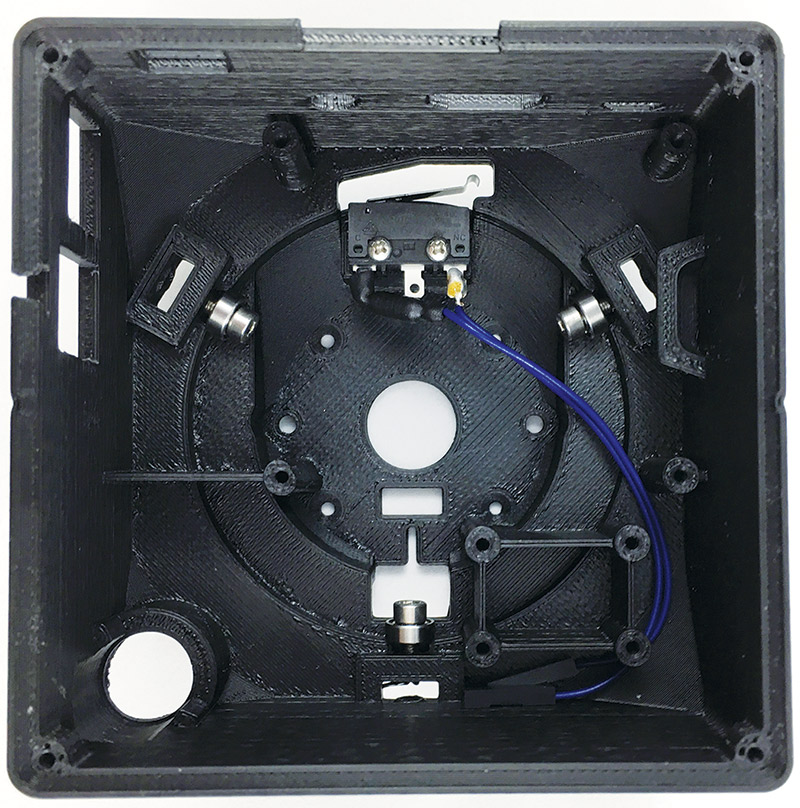
Figure 8. The micro-switch installs with two self-tapping screws. Tucking the large resistor away was a bit of a challenge. Leaving slightly more lead exposed out of the solder joint would have made it easier.
The switch arm protrudes from an opening in the enclosure (Figure 9) and is activated by an extrusion on the scanner tower.
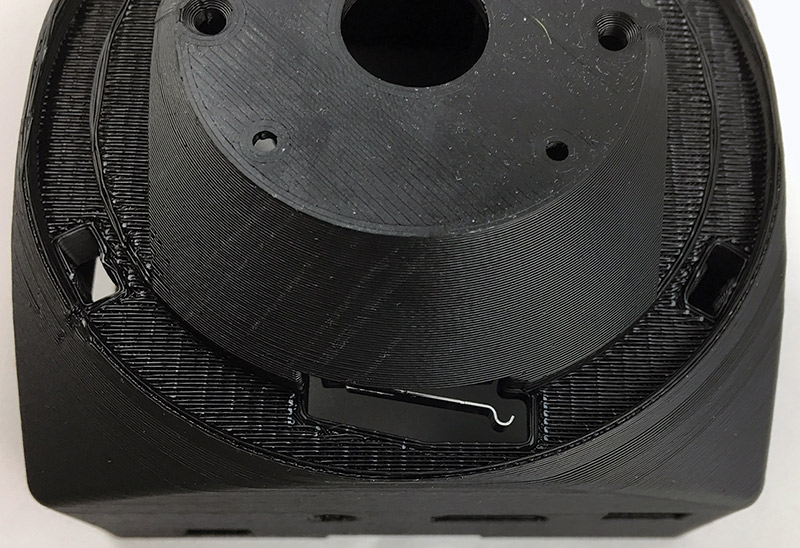
Figure 9. Good enclosure design has the switch arm just protruding out into the travel ring of the scanner tower. An extrusion on the tower cleanly trips this switch for homing position information.
Similarly, I installed the stepper motor, trimming and tinning the leads, then securing it with two M3 screws (Figure 10). The instructions indicate that cutting the leads to about 100 mm is best, but I found those a bit short on final assembly, so I would recommend about 115 mm lead lengths.
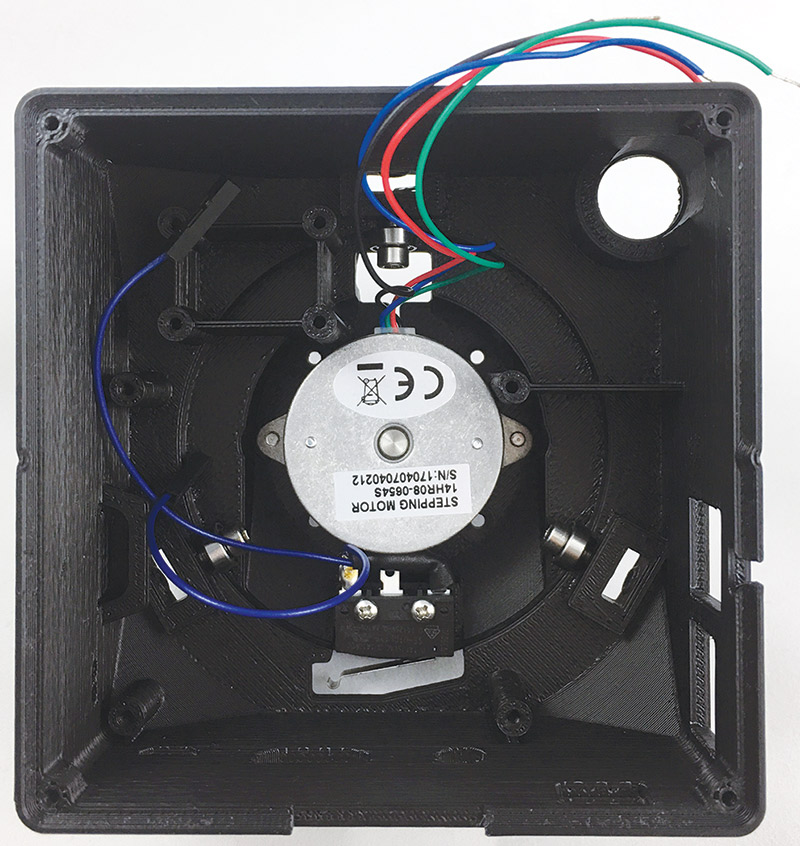
Figure 10. The stepper motor installs with two M3 screws. Trim and tin the leads before installation. I found leaving a little more than the recommended lead length was helpful.
Next, we assemble the stepper motor control HAT for the Raspberry Pi. This is a standard Adafruit mini kit. Pay close attention to the photos in the assembly guide as the screw terminals are installed backwards, with the side the wire goes in facing the interior of the PCB.
I then installed the three- and four-pin right angle headers before realizing that the large Pi connector needed to be installed first. A bit of hot air gun work later and all headers were installed.
Scanse recommends using a jumper to ensure proper spacing when soldering the headers (Figure 11). This worked well, but the headers do get very close to other connections. Double-check for any shorts before proceeding, then go ahead and put the HAT onto the Pi (the screw terminal blocks go on the same side as the Ethernet port).
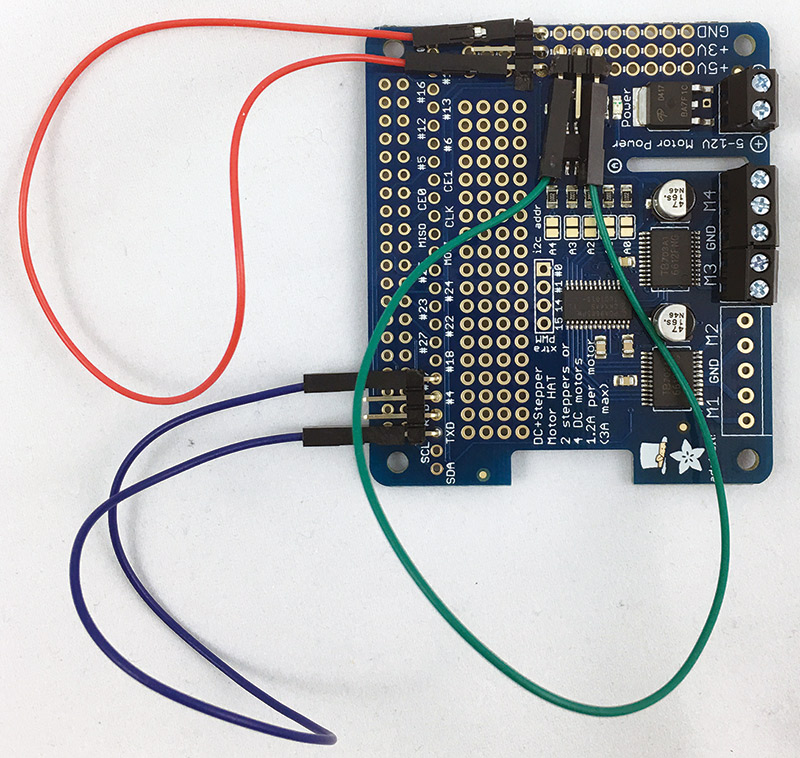
Figure 11. When soldering the headers onto the HAT, use jumpers to ensure the headers have enough vertical clearance for jumpers to be pushed on later. Be sure to install the Pi connection header first!
The HAT itself is powered directly from the USB battery pack using a micro USB connection. Take the micro USB cable and cut it about 4” from the female end. Strip the outer sheath and cut the data wires, leaving only the red and black power wires exposed. Strip them back about 0.25” and tin the connections. Then, tidy up with a piece of heat shrink to ensure no stray shield wires are shorted to anything (Figure 12).
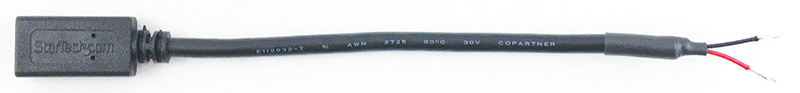
Figure 12. Cut the provided USB cable and make a clean power lead to power the motor shield.
The cable feeds through a 3D printed bracket that wedges between the USB and Ethernet ports, and then sticks to the top of the Ethernet shield with double-stick tape. The power leads are then secured into the power terminal block (Figure 13).
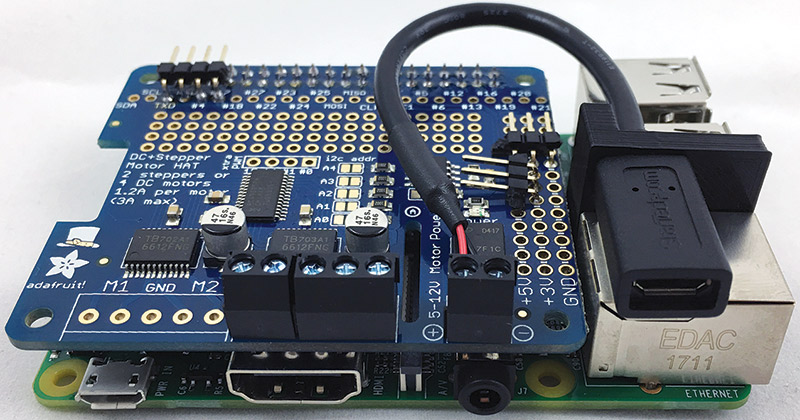
Figure 13. A 3D printed bracket and some double-stick tape mount the USB connector on top of the Pi’s Ethernet jack. Secure the power wires to the HAT’s power terminals.
Back to the mechanical assembly; it’s time to install the bubble level. This level is especially handy when running the Sweep from a tripod. The level is inserted into the upper enclosure from the bottom and then glued into place (Figure 14). The instructions tell us to level the bubble while the enclosure is sitting on a level surface and then glue. I simply couldn’t find a good way to do this, but it seems to have seated into the print relatively level to start with. A top loading design or snap-in fixture could be a useful addition here.
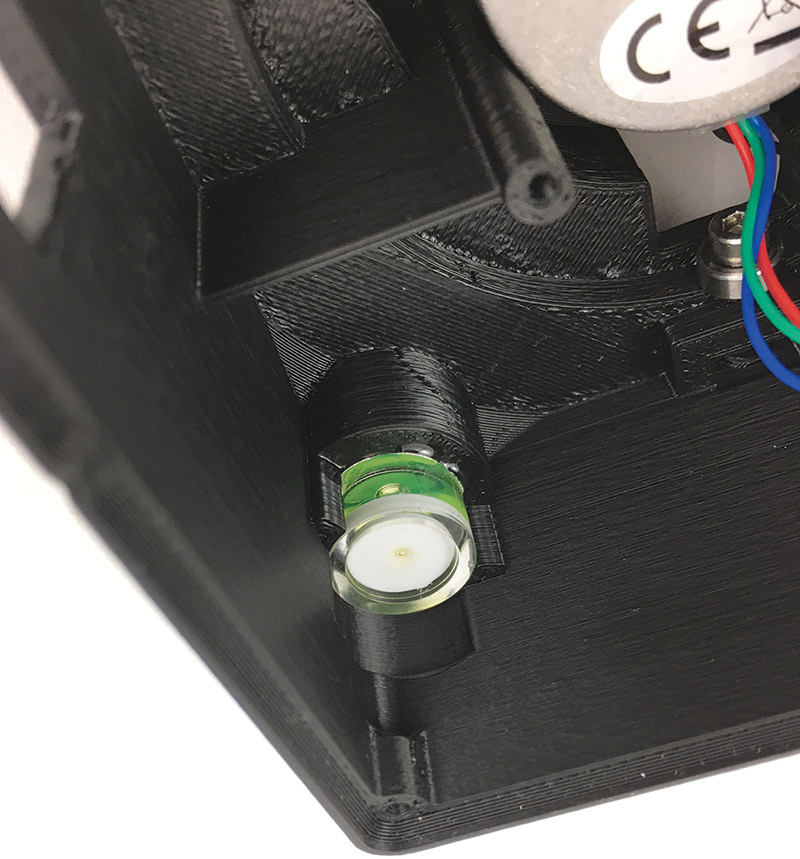
Figure 14. The bubble level installs from the bottom of the enclosure, making it difficult to ensure that you have it seated properly when gluing. I found it wasn’t far off, though, thanks to the good fit and finish of the printed part.
Now, we can put the Pi and HAT into the upper enclosure with four self-tapping screws and nylon spacers to ensure clearance between the HAT and Pi. The screws go in easily, but hold very well. A lot of trial and error went into getting the right fit I’m sure. The Pi is a bit difficult to get seated into place, but a few minutes of wiggling gently and I was able to get it installed (Figure 15).
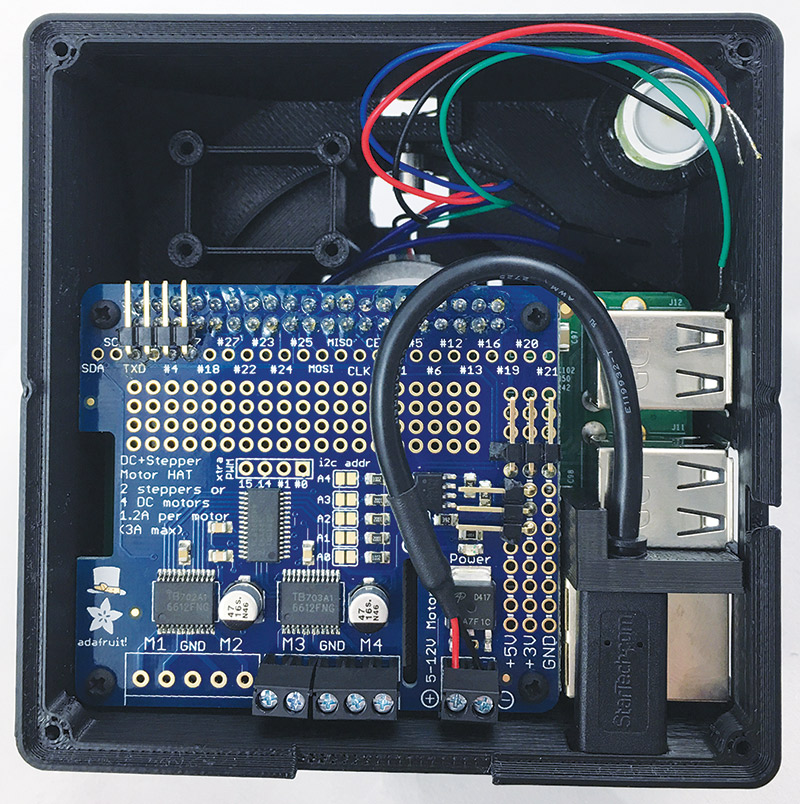
Figure 15. The Raspberry Pi is a snug fit, but with some wiggling it eventually snapped into place. Holding the standoffs in is a bit tricky, but the four screws do firmly secure the entire assembly.
The next component to go on is the tower and Sweep sensor. The tower uses a self-tapping set screw to register to the flat of the stepper motor shaft. The cable for the Sweep feeds down the column, and the Sweep itself is held on by four screws that go into threaded inserts on the unit’s base (Figure 16). The cable then goes through a slot in the top of the base enclosure.
 .
.
Figure 16. Four screws hold the Sweep scanner onto the vertical scanning mount.
I found it easiest to take the USB adapter off and re-install it in the base of the unit.
The cable then feeds out through a retainer and plugs into the Pi’s USB port (Figure 17).
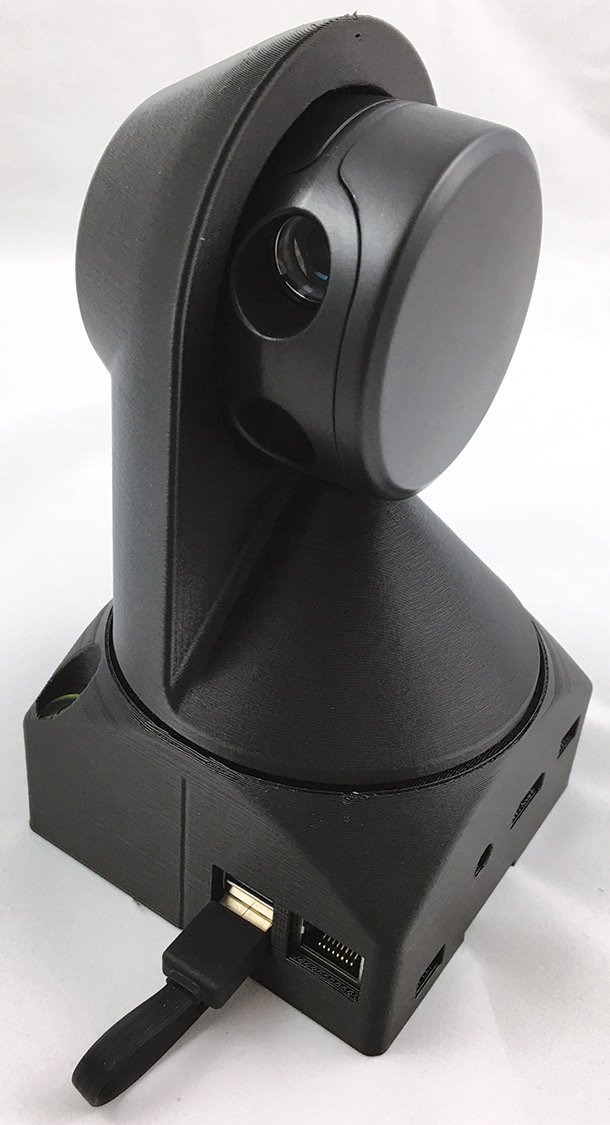
Figure 17. The USB cable routes out of the top half of the case and plugs directly into the Raspberry Pi.
Again, attention to detail like the cable retaining clip was very nice (Figure 18).
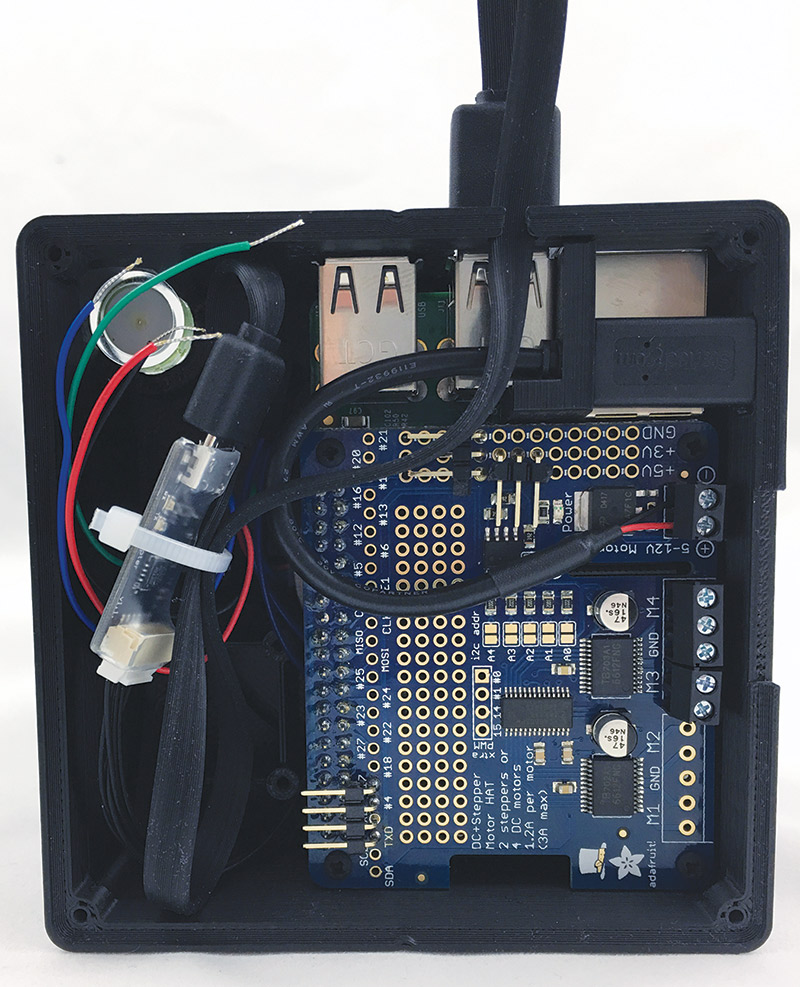
Figure 18. The wire compartment holds the USB adapter and the cable is held in place by a nicely designed retaining clip.
Next, we connect the motor and limit switch to the Pi. The limit switch goes to pin 17 and the 3V rail. The cable to the 3V rail was a tiny bit short, but bending the pin slightly made it work. The motor connects to the terminal blocks as shown in Figure 19.
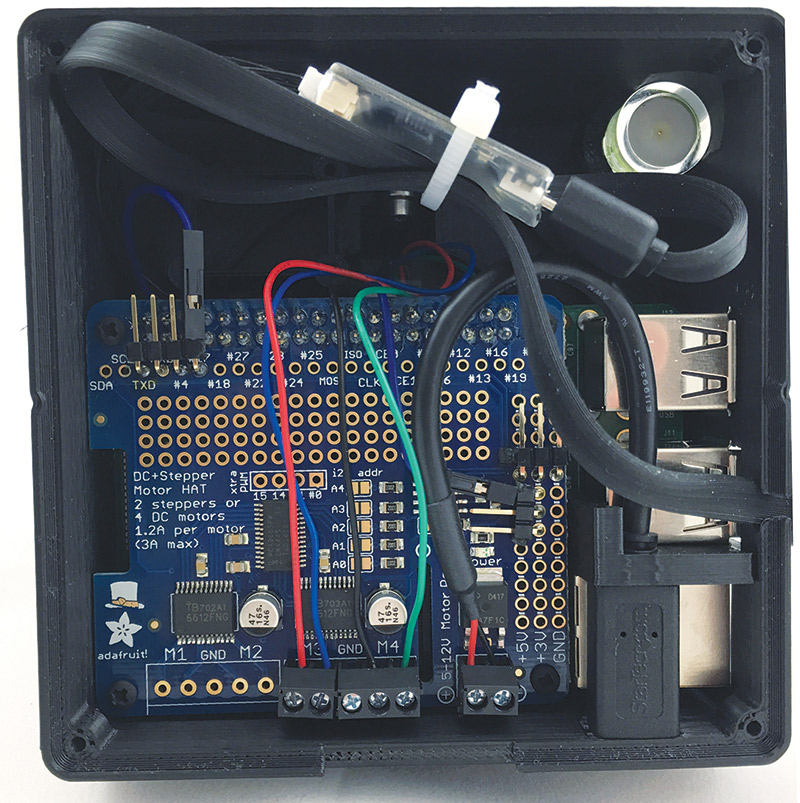
Figure 19. Wires from the stepper motor connect to the screw terminals on the HAT and leads from the micro-switch push onto headers. Cutting the wires slightly longer would have been helpful.
Let’s turn our attention to the base of the unit. A 1/4”-20 nut allows the unit to be affixed to a tripod for support and leveling. The nut is installed using a technique similar to the threaded melt-in inserts that I’m so fond of for 3D printed parts. The instructions recommend using a soldering iron set to 382°C for installation, but I left mine at 345°C. It took about 60 seconds to melt in, but the lower temperature gave me more time to make sure it was melting into the print straight.
I stopped when the top of the nut was flush with the top of the print (Figure 20). In hindsight, that wasn’t deep enough for a tripod to catch, so melt the nut to the bottom of the pocket in the case. There’s enough metal that the nut stays hot for some time, so give it a while to cool before proceeding.
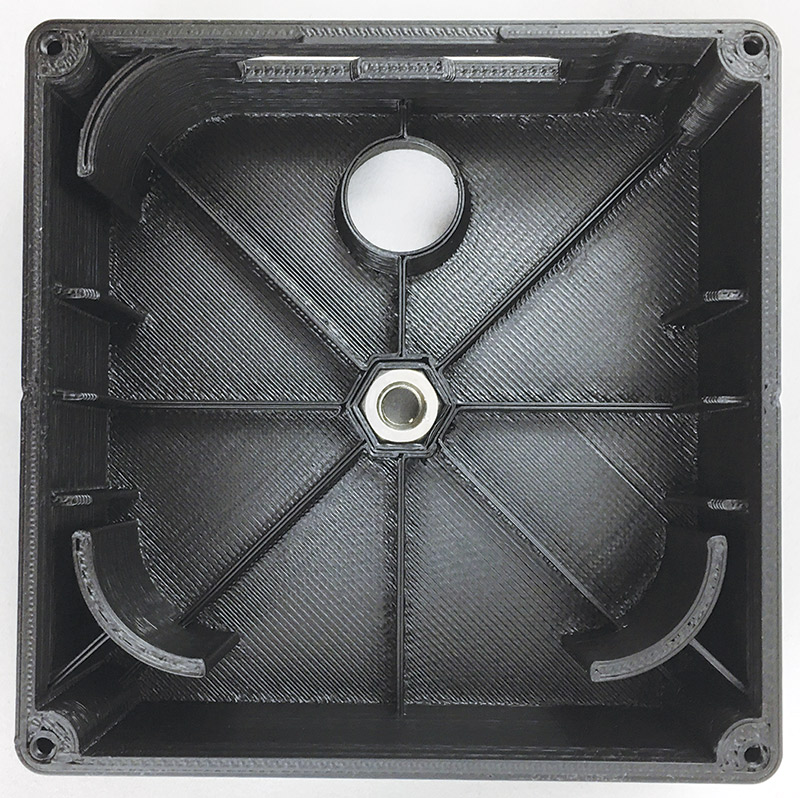
Figure 20. The 1/4”-20 nut melts into the bottom housing. I didn’t melt mine in deep enough initially and the tripod mount didn’t reach the threads.
Once everything is cool, snap the battery into the case (make sure your orientation is correct) and double-check that the 3D printed button turns the battery on. There is an SLA printed light pipe that is installed with some double-stick tape. The light pipe’s performance coupled with the not-so-bright LEDs on the battery make it difficult to see, but you can make out the green lights from the outside of the enclosure.
The last electronics bit to install is the inertial measurement unit (IMU) that will allow the sweep to determine its orientation in space. Solder the headers onto the breakout with pins facing upwards towards the component side, and then connect the wires to the power rails and communications as directed in the instructions.
I found it easiest to connect the wires to the IMU, then install the IMU into the case with four self-tapping screws. Next, connect the jumpers to the Pi. All the wires can tuck nicely into the upper half of the case (Figure 21).
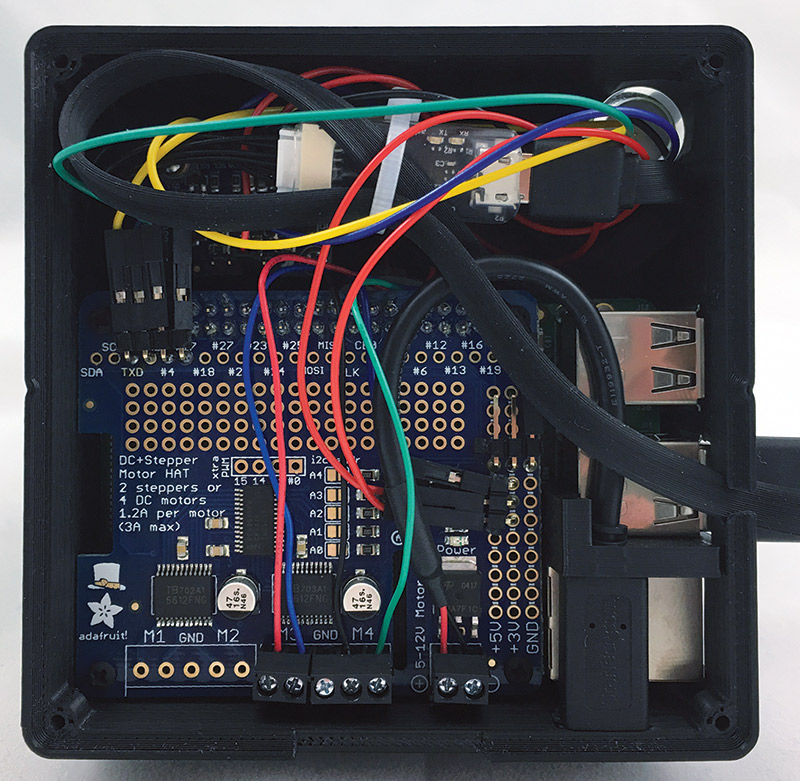
Figure 21. Install and connect the IMU in the pocket at the top left. The wiring compartment gets pretty crowded!
Finally, the upper and lower halves are joined with four more self-tapping screws. We can then connect the Pi and the HAT to the USB power pack with the provided stubby USB cables. I found that I needed to fiddle a bit with the position of the double-stick tape USB jack to get it to line up, but it wasn’t much trouble. Ensure that all of the plugs are firmly seated, not catching on a stray fragment of 3D print (Figure 22). We’re now ready to get the software set up and start scanning!
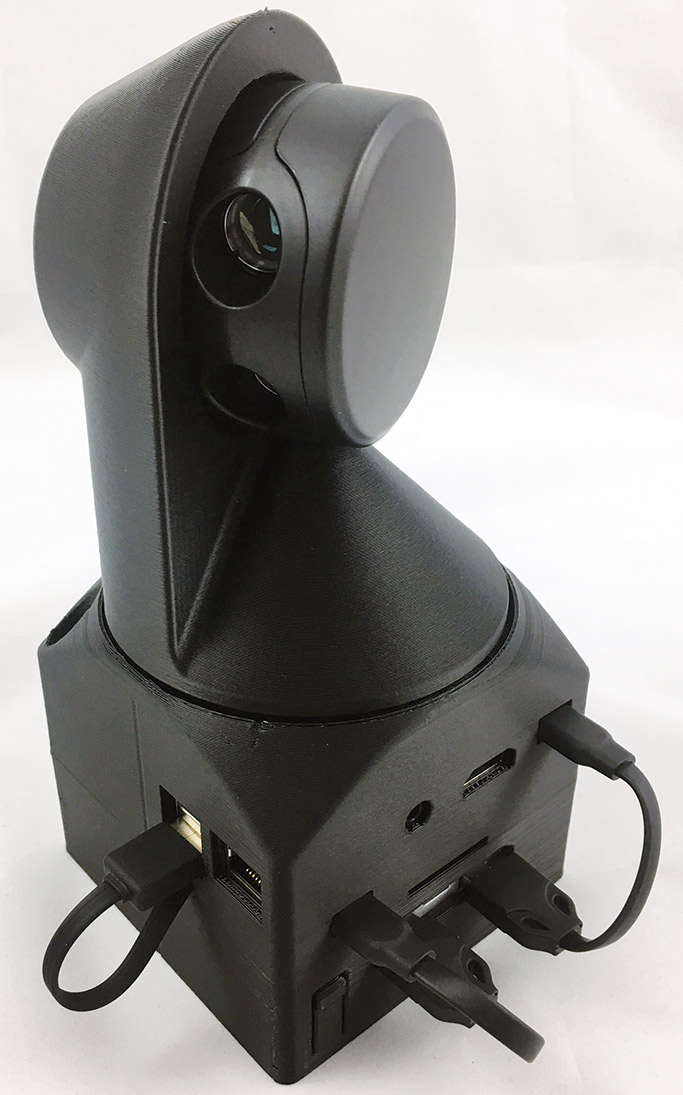
Figure 22. Assembling the top and bottom of the base and plugging in the USB cables completes assembly of the scanner. It is a nice compact unit that is completely self-contained.
Software Installation
The software that runs the scanner on the Pi can be found on the Scanse GitHub page (https://github.com/scanse/sweep-3d-scanner) and can be installed from scratch. However, the project’s Wiki (https://github.com/scanse/sweep-3d-scanner/wiki shows us an easier way. There are pre-built SD card images for the Pi that include the operating system and the scanner software installed and pre-configured. First, we need to download the most recent SD card image. At the time of this writing, that was version 0.3; about a 430 MB download. While the image is downloading, head over to https://etcher.io and download their free SD card imaging utility. Using the adapter included in my kit, I was able to select the image and burn it to the card in just a few minutes (Figure 23).
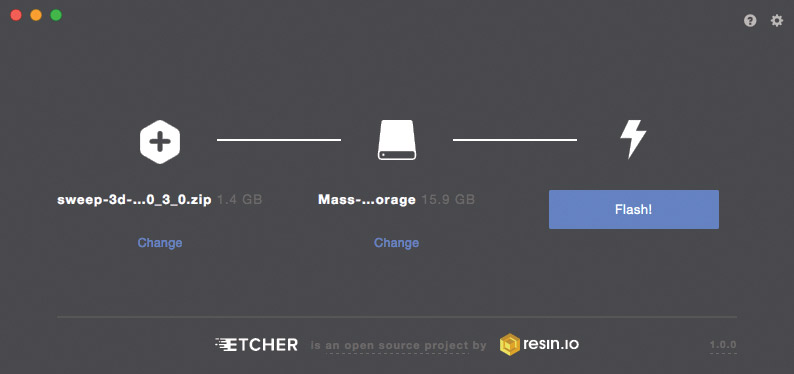
Figure 23. Select the empty SD card and the downloaded image to burn with Etcher.
After the image was successfully Flashed, I inserted the card into the Pi and pressed the power button on the case that activated the USB battery. The Pi booted up and after a few minutes, I saw a new wireless network appear; one called Pi3-AP. The image makes the Pi a Wi-Fi access point on bootup! I connected to the network with the passphrase “raspberry” and was ready to gain access to the Pi.
While you can connect a monitor and keyboard to the Pi, that really isn’t very convenient. Connecting to the Pi through a secure shell connection (SSH) is by far the easiest way to gain access to the machine.
Open a terminal on your Mac/Linux machine, or open an SSH client such as PuTTY (www.putty.org) on your Windows machine. Verify that it’s connected to the Pi3-AP network, and then connect as user pi to the IP address 172.24.1.1. The syntax for this on the terminal is ssh pi@172.24.1.1. The default password is “raspberry.”
Once connected, you should find yourself presented with a terminal on the Pi.
The first order of business is to expand the file system of the Pi to entirely fill the SD card. Run the command sudo raspi-config —expand-rootfs and wait for the command to return. Then, reboot the machine with the command sudo shutdown -r now. The network will go away as the machine reboots.
Once it is back up, connect to the network again. We’re ready to collect some data!
Collecting Data
The entire system is controlled through a web based application hosted on the Raspberry Pi. Once the system is booted and you have connected your phone/tablet/computer to the Pi3-AP network, open your favorite web browser and navigate to http://172.24.1.1:8080. You should see a page like that in Figure 24 load. This dashboard allows you to test and control the 3D scanner.
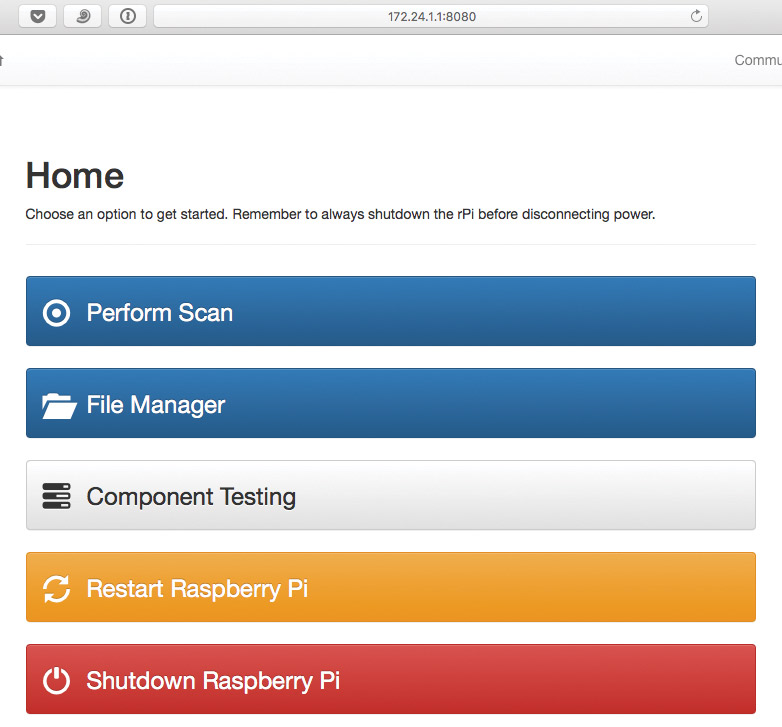
Figure 24. The main menu of the 3D scanner’s web app allows you to test components, manage files, or create a new scan. Always be sure to shutdown/reboot your Pi from the app or SSH before removing power!
Before trying to collect actual data, it’s always wise to perform some system checks — especially since this is a newly assembled kit. In the ‘Component Testing’ menu, there are tests to check proper operation of the limit switch, stepper motor, and scanner. I ran each of these individually and verified that each system was working. I had problems communicating with the scanner, but unplugging and re-plugging its USB cable into the Pi solved the issue.
I sat the scanner on my dining room table and pressed the Perform Scan button. I set the sweep rate to 1 Hz and the data collection rate to 500 Hz (Figure 25). After pressing start, the unit spun up the sensor and homed, then began the scan. The scan wasn’t incredibly fast since I had selected a pretty high resolution set of parameters.
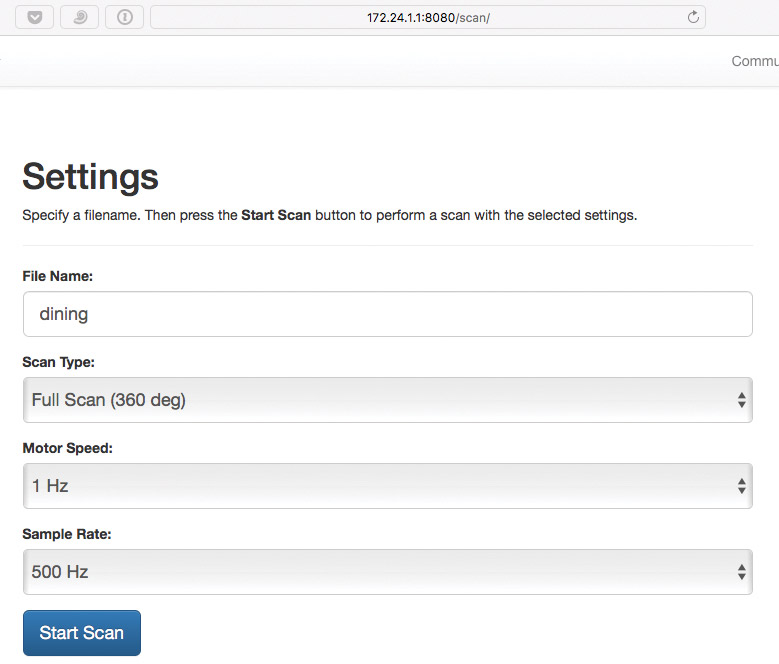
Figure 25. Select the scan parameters in the web app and then click “Start Scan.” I found that any connection issues could be solved with a restart.
After a couple minutes, the scan was completed, and I followed the link to the file manager. Here, you can download scans to your local machine for visualizing, or delete scans from the Pi. I downloaded the scan of the dining room and proceeded to move to the living room. Here, I couldn’t get a new scan initiated, but a quick reboot seemed to fix that. Remember, the software is still beta!
After taking a scan of the living room, I downloaded that file, then shut the unit down and started to play with the data.
Before we get into how to view that data, I want to outline the set of conditions I tested the scanner under. I tested inside the house, outside in the yard in bright sun, and at a long-range target. These should give us an idea of the scanner’s capability. During the tests, I noticed that the black ABS enclosure got very hot in direct sunlight. While I’m not sure what the internal temperatures reached, I wouldn’t necessarily recommend leaving the unit in direct sun for prolonged periods of time.
Visualizing Data
To visualize the data, we’ll use the Sweep Visualizer tool available for download from the Scanse website (http://scanse.io/downloads). You can download my data from the article link or a GitHub repository (https://github.com/jrleeman/sweepscans) and play along without any hardware.
While the Sweep Visualize is downloading, open your favorite text editor and peek at the scan data. Data are stored as plain text comma separated files. Each row contains a data point with the scan index (angular position of the scanner head); X, Y, and Z values for the data point; and the returned signal strength (Figure 26). In fact, with a few lines of Python, you can make your own plot, but the Sweep Visualizer has some nice features that make combining scans and exporting the results much easier.
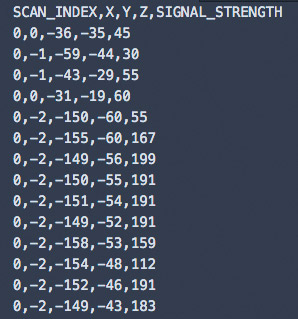
Figure 26. Scans are stored as plain text and can be plotted by any program you desire.
Open the Visualizer and click on the “Map” tab at the top. Then, click on the “Add Pointcloud” button and select the CSV file for the scan you wish to load (Figure 27).
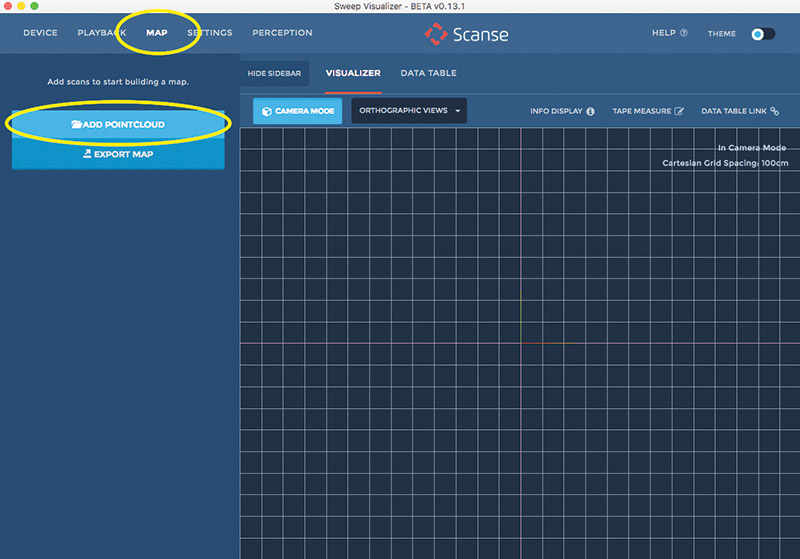
Figure 27. Select the Map tab and load a point cloud into the Sweep Visualizer.
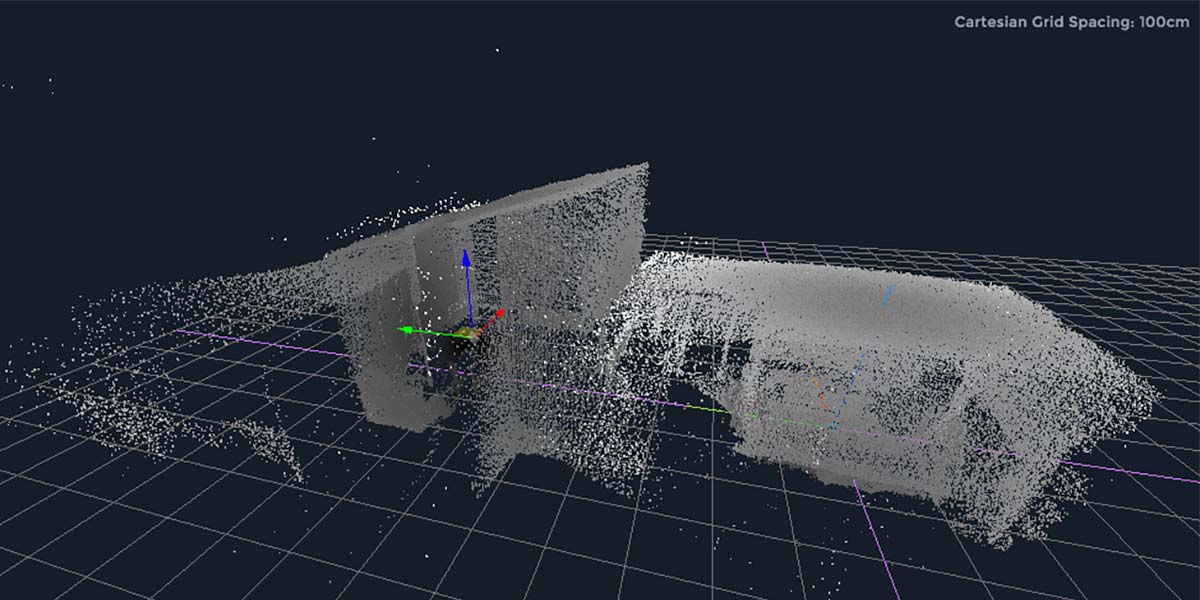
The points will appear in the viewer and you can explore the data (Figure 28). The scroll wheel on your mouse allows you to zoom in and out, left-click rotates the view, and right-click pans the view.
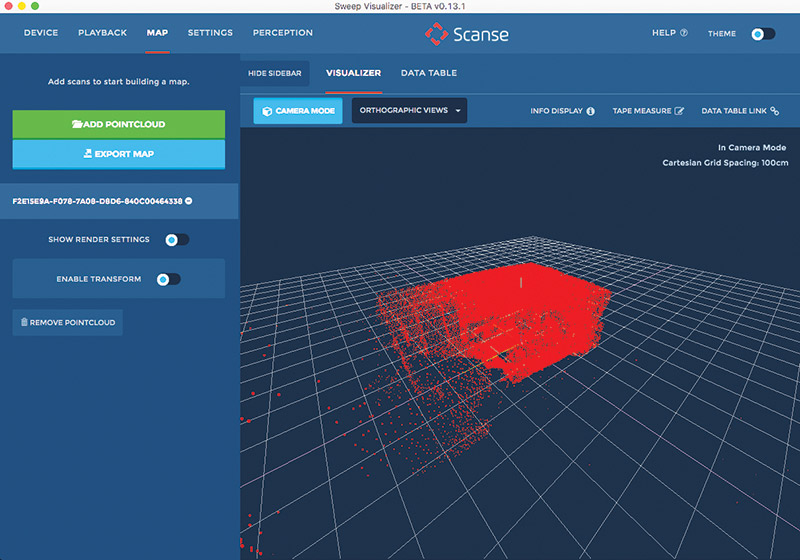
Figure 28. Once the point cloud is loaded, we can see the shape of the room and zoom/pan/orbit to explore the dataset.
The first thing I do in the Visualizer is turn on the toggle for “Show Render Settings” and turn the point size down to a minimum (Figure 29). This makes the data more “transparent” and easier to navigate if you’ve collected a high-resolution scan. There are several options to play with here, including what color the points are based on range or returned signal strength. I’ve found that solids or grayscale based on signal strength with a very limited color band seem to work best.
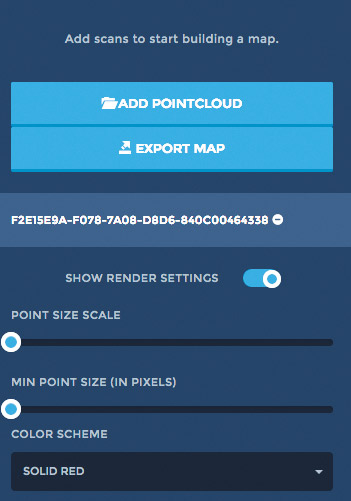
Figure 29. Reducing the point size to the minimum in the render settings helped me more clearly explore the data. You can also play with color schemes and variables here.
Load up the living room scan file from the materials associated with this article. Set the point color to solid red and the points to the smallest size possible. Next, load the dining room scan file and set the points to green and the smallest size possible. Toggle the “Enable Transform” switch under the dining room point cloud (Figure 30) and then click the “Translate” button. You will see a Cartesian coordinate tool pop up in the middle of that point cloud.
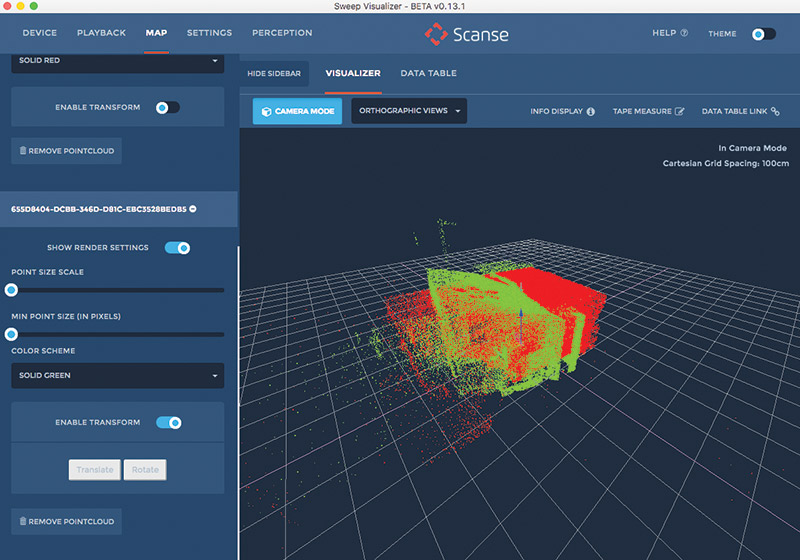
Figure 30. With two scans loaded, selecting different colors helps differentiate them as they are initially located at the same origin.
You can click any of the three cardinal direction vectors and drag the dataset in X, Y, or Z. You can also click the “Rotate” button and get three rings that can be manipulated to rotate the dataset into any orientation.
In the scan data, you can see that the dining room scan captured parts of my living room ceiling outline (there is a large open overlook). Using these as fiducials, we can line up the two scans with a few simple moves (Figure 31).
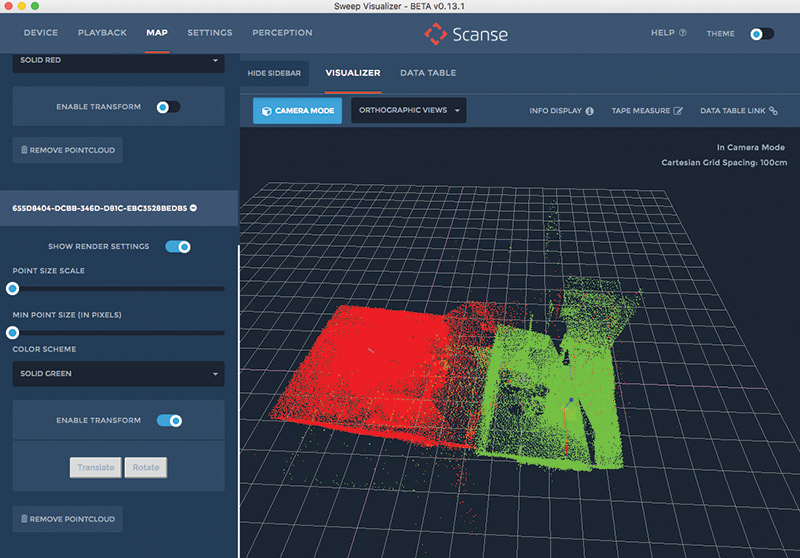
Figure 31. After a few minutes of translating and rotating the datasets, the two rooms of the house were properly joined.
Once the scans are aligned, I changed the color settings and was able to get a really nice view of the interior of those two rooms (Figure 32).
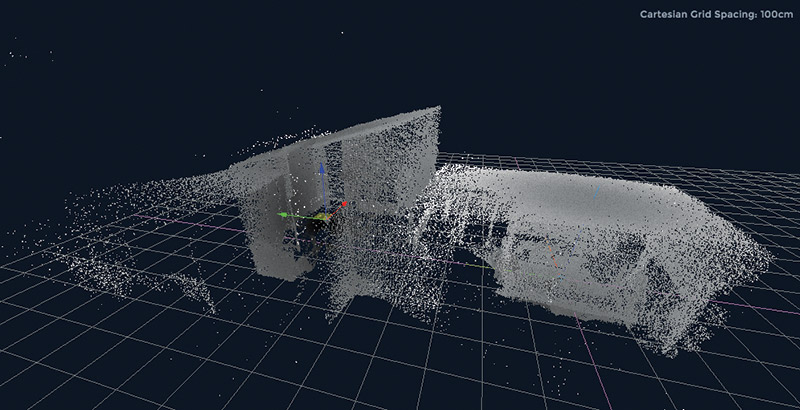
Figure 32. Modifying the display settings and view angle produces a good view of how the rooms connect. Scans could even be taken on multiple floors and combined in the Sweep Visualizer.
The detail captured in the living room was especially impressive (Figure 33).
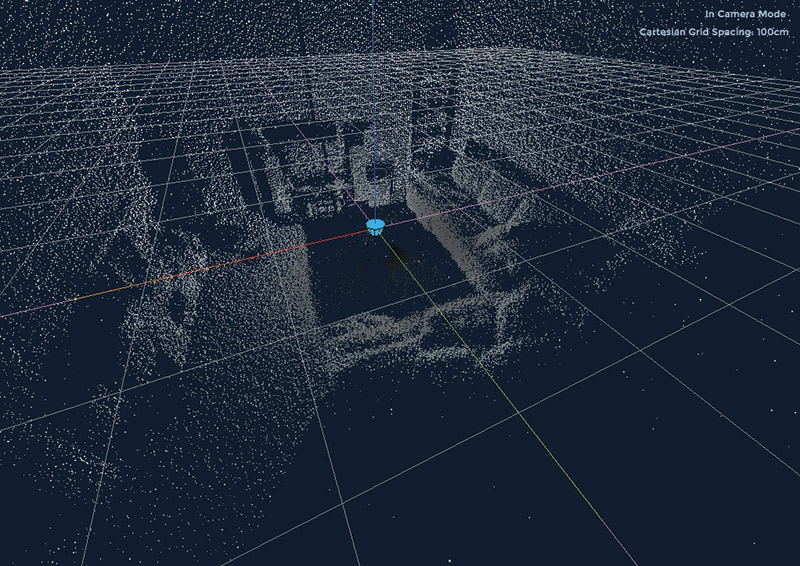
Figure 33. The level of detail captured was stunning. In this scan of a living area you can see the couches, media system, and storage.
The outside scans performed very well, capturing the outline of my yard, deck chairs, and even my wife and me sitting out watching the scan (Figure 34). I can imagine that having a time series of 3D scans of the trees surrounding my house could be interesting to monitor their growth and model any potential fall hazards to the house. There were a few stray points up in the sky, but not a dome of pseudo-reflectors.
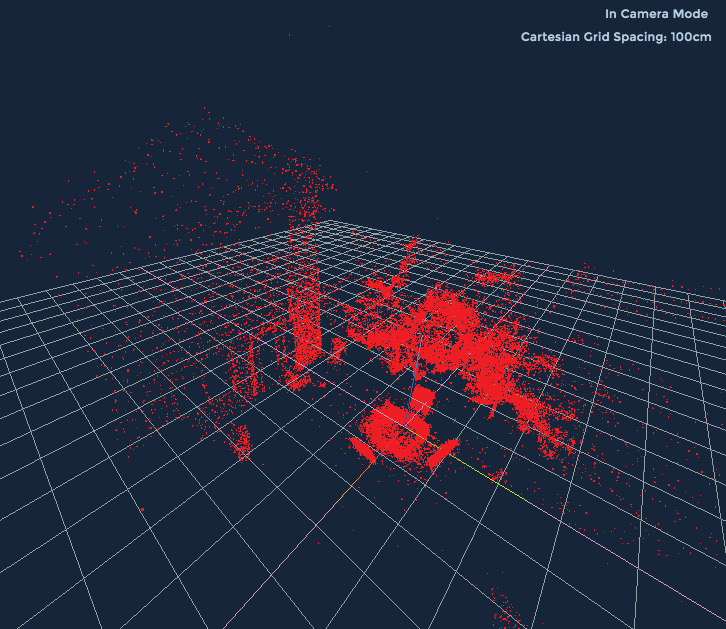
Figure 34. An outdoor scan shows trees, lawn furniture, the house, and even me and my wife. The scan also captured our fence and will help me easily measure it when it comes time to replace it.
At long ranges, the resolution of the scans is reduced. The same angular resolution (data points/degree) at an increased radius produces a larger arc length, therefore more sparse population in space. The maximum range is about 40 meters; mapping buildings across a street did not resolve any appreciable detail.
Closing Thoughts
The Sweep sensor and the 3D scanner unit are certainly impressive products. I was able to provide some feedback to the team on the design to help ease the assembly process, and also on the software. Occasionally, the scanner would need to be rebooted before it could successfully perform a new scan, but with the rapid pace of software development, I cannot imagine that being an issue for long. The performance and resolution of the scanner is very impressive — especially for such a low-cost project that is accessible to any basement hobbyist.
The Scanse team has been developing drivers for the Arduino, Robot Operating System (ROS), Pixhawk flight controller, and others. I’m really excited to see where this project can go and how it can be integrated into homebuilt robots.
Drones could avoid obstacles instead of blindly crash into them; ground based robots could map their environments and optimize their path from one point to another. (A lawn mowing robot would be a great use, for example.) For conducting surveys in remote areas, the sweep could be affixed to an aerial platform that is flown into the area, lands, collects a scan, hops further away, lands, collects another scan, etc.
I know I’m certainly going to be scanning all kinds of objects to see what neat visualizations and information I can create.
Until next month, fly (and scan!) safely! SV
Article Comments